
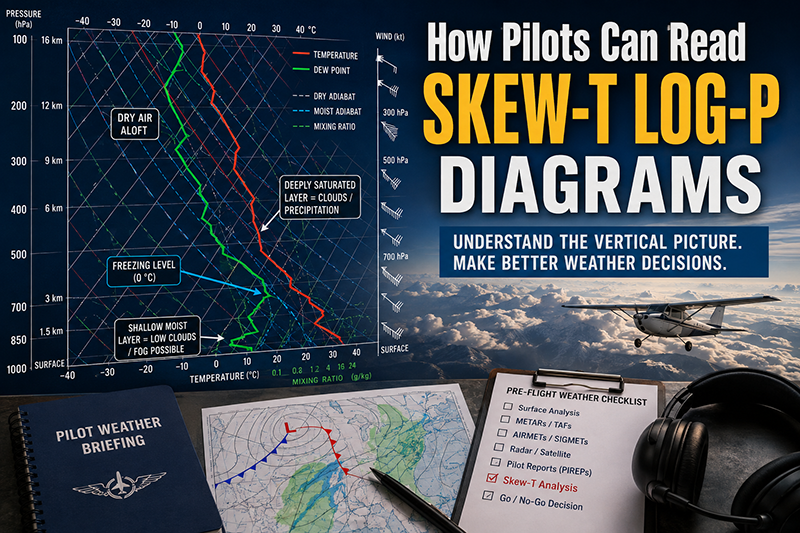
Skew-T Log-P diagrams give pilots a vertical picture of the atmosphere that ordinary surface observations and basic forecasts cannot show by themselves. For a pilot, that vertical picture matters because clouds, turbulence, icing potential, convective development, and visibility trends are often controlled by how temperature, moisture, and wind change with altitude.
Many pilots first encounter a Skew-T during advanced weather study and assume it is mainly a meteorologist’s tool. It is a meteorologist’s tool, but it can also be a practical flight planning aid when used correctly. A Skew-T does not replace official aviation forecasts, weather briefings, radar, satellite imagery, pilot reports, AIRMETs, SIGMETs, or sound aeronautical decision-making. It does, however, help a pilot understand why a forecast looks the way it does and where the atmosphere may be favorable for layered clouds, embedded convection, freezing-level concerns, or instrument meteorological conditions.
This article explains how pilots can read a Skew-T Log-P diagram in plain aviation language. The goal is not to turn every pilot into a professional forecaster. The goal is to help pilots ask better weather questions, recognize warning signs, and use vertical atmospheric data more intelligently before flight.
What a Skew-T Log-P Diagram Shows
A Skew-T Log-P diagram is a thermodynamic chart that plots atmospheric temperature, dew point, pressure, and often wind with height. The name comes from two features of the chart. Temperature lines are skewed diagonally rather than drawn straight up and down, and pressure is plotted on a logarithmic scale. That chart design allows important atmospheric relationships to be displayed in a compact, readable way.
Most pilot-facing Skew-T diagrams show two main traces. The temperature trace shows the environmental air temperature at different pressure levels. The dew point trace shows the temperature to which air would need to be cooled to become saturated at each level. When the temperature and dew point traces are close together, the air is nearly saturated and clouds or precipitation may be present. When they are far apart, the air is relatively dry at that level.
The vertical axis is usually pressure, commonly labeled in millibars or hectopascals. Pressure decreases with altitude, so the top of the chart represents higher altitudes. Pilots often think in feet MSL, but Skew-T diagrams typically use pressure levels because the atmosphere is a pressure-based system. Many online tools provide approximate altitude scales along the side, but those altitudes should be treated as approximate because pressure altitude and true altitude vary with the weather pattern.
Wind is often displayed along the side of the chart using standard wind barbs. These show wind direction and speed at different levels. For pilots, this is valuable because a Skew-T can reveal wind shear, low-level jets, strong winds aloft, and directional changes with height that may affect turbulence, climb performance, groundspeed planning, and approach stability.
Why This Matters in Real-World Aviation
Aviation weather decisions are often about vertical structure. A METAR may report a ceiling at the airport. A TAF may forecast broken clouds or rain. Radar may show precipitation. But the pilot still needs to understand what is happening above and below those observations. Are there multiple cloud layers? Is the freezing level close to the cloud base? Is the atmosphere stable enough for widespread stratus, or unstable enough for building cumulus and thunderstorms? A Skew-T helps answer those questions.
For VFR pilots, the diagram can help explain whether a marginal ceiling is likely associated with a shallow moist layer or a deep saturated profile. A shallow layer may burn off or lift under the right conditions, while a deeper saturated layer may persist. A Skew-T can also help identify dry air aloft, which may indicate better visibility above a cloud deck or potential for cloud breaks, depending on the larger weather pattern.
For IFR pilots, the Skew-T can add context to route planning. It may show the depth of cloud layers, freezing levels, and wind changes aloft. This matters when choosing an altitude, evaluating icing exposure, or deciding whether a flight has enough margin to remain safe and legal. A pilot flying a normally aspirated piston aircraft, for example, may not have many altitude options if clouds, terrain, icing potential, and aircraft performance all compete for the same limited vertical space.
For flight instructors, Skew-T diagrams are excellent teaching tools because they connect textbook weather concepts to operational decisions. Students often memorize terms such as lapse rate, temperature-dew point spread, stability, and lifting condensation level without seeing how those ideas appear in real data. A Skew-T makes those concepts visible.
How Pilots Should Understand the Axes and Lines
The most important first step is learning what you are looking at before trying to make a flight decision from it. On a typical Skew-T, pressure levels run horizontally across the chart and decrease upward. Near the bottom of the diagram, pressure may be close to the surface value. Higher up, pressure levels such as 850, 700, 500, and 300 millibars represent progressively higher levels of the atmosphere.
Temperature is shown using diagonal lines that slope upward to the right. Because the temperature lines are skewed, a temperature trace that leans left or right can look unusual to a new user. Do not interpret the angle of the plotted temperature trace as if it were on a normal rectangular graph. Instead, compare it to the background temperature lines and pressure levels.
The environmental temperature trace is usually the line farther to the right, although colors vary by provider. The dew point trace is often plotted to the left of the temperature trace. When those two lines nearly touch, relative humidity is high. If they remain close together through a deep layer, the atmosphere may support thick clouds or precipitation. If they only touch in a shallow layer, the result may be a thin cloud layer, fog, or a low stratus deck depending on the surface pattern and local terrain.
Skew-T charts also include dry adiabats, moist adiabats, and mixing ratio lines. These are useful for deeper analysis, but pilots do not need to master every calculation to gain practical value. A dry adiabat shows how unsaturated air cools as it rises. A moist adiabat shows how saturated air cools as it rises, with latent heat release slowing the cooling rate. Mixing ratio lines relate to moisture content. Together, these background lines allow meteorologists to estimate cloud base, parcel buoyancy, and convective potential.
For everyday pilot use, focus first on four practical questions: Where is the air moist? How deep is the moist layer? What is the temperature in that layer? How do winds change through that layer? Those questions connect directly to clouds, icing potential, turbulence, and operational risk.
Reading Stability on a Skew-T
Atmospheric stability describes whether air resists vertical motion or tends to keep rising once lifted. Stable air suppresses vertical development and often favors layered clouds, smooth air, widespread reduced visibility, or steady precipitation. Unstable air supports rising motion, cumulus growth, showers, turbulence, and thunderstorms when enough moisture and lift are present.
On a Skew-T, stability is assessed by comparing the environmental temperature profile with the rate at which a lifted air parcel would cool. If the environmental temperature decreases rapidly with height, rising air may remain warmer than its surroundings and continue to rise. That is instability. If the environmental temperature decreases slowly with height, or increases with height in an inversion, rising air becomes cooler than its surroundings and tends to sink back. That is stability.
A temperature inversion is one of the most useful stability features pilots can identify. In an inversion, temperature increases with altitude through a layer instead of decreasing. This acts like a lid. Moisture, haze, smoke, and pollutants may become trapped below it. Low clouds may spread out beneath it. In cold-season operations, an inversion can also separate warm air aloft from colder air near the surface, creating complex precipitation and icing concerns.
A steep lapse rate, where temperature drops quickly with altitude, can suggest instability. If moisture is present and there is lift, that instability may contribute to cumulus development, showers, or thunderstorms. If the layer is dry, a steep lapse rate may still produce turbulence, especially during daytime heating or over rough terrain. A dry convective boundary layer can be uncomfortable even without visible clouds.
Pilots should be careful not to use stability in isolation. An unstable sounding with little moisture may not produce clouds. A moist sounding with limited lift may produce widespread cloud but little vertical development. A stable sounding can still contain hazardous weather if it includes low ceilings, freezing drizzle potential, mountain obscuration, or strong wind shear. The Skew-T is a diagnostic tool, not a yes-or-no forecast.
Using Temperature and Dew Point to Anticipate Clouds
The temperature-dew point spread is one of the easiest and most useful features for pilots to read on a Skew-T. When the temperature and dew point lines are close, the air is near saturation. If they are close from the surface upward through a layer, clouds or fog may exist in that layer. If they become close aloft but remain separated near the surface, clouds may be present above a dry lower layer.
Cloud bases can sometimes be estimated from the level where a rising parcel becomes saturated, known as the lifting condensation level. On a Skew-T, this can be approximated using the surface temperature and dew point with the background lines, although many pilots use automated tools for this estimate. The key operational point is that a small surface temperature-dew point spread often supports low cloud bases or fog, particularly when winds, terrain, nighttime cooling, or moisture advection support saturation.
Cloud tops are often more challenging. A layer where temperature and dew point remain close may indicate cloud depth, but the relationship is not perfect. Some cloud layers may exist even when the traces are not exactly touching, and some saturated-looking layers may not produce significant clouds depending on the data quality and atmospheric motion. Still, a deep layer of close temperature and dew point traces is a strong clue that a pilot should investigate cloud depth, precipitation, and instrument conditions carefully.
Dry layers are also important. A dry layer beneath cloud can cause precipitation to evaporate before reaching the ground, producing virga. Virga may be associated with downdrafts and turbulence. A dry layer above a moist boundary layer may cap vertical cloud growth, producing flatter cumulus or stratocumulus. A dry intrusion aloft can also influence thunderstorm structure, but convective forecasting requires more than a simple glance at a single diagram.
Evaluating Icing Potential with a Skew-T
Icing potential is one of the most important reasons pilots study Skew-T diagrams. Aircraft icing requires visible moisture and temperatures conducive to ice accretion on the aircraft. A Skew-T can help identify where those ingredients may overlap vertically. It is especially useful for comparing cloud layers with temperature levels near and below freezing.
A practical pilot scan begins by locating the freezing level, where the temperature trace crosses 0 degrees Celsius. Then examine whether the temperature and dew point traces are close together in the subfreezing layer. A saturated or nearly saturated layer with temperatures below freezing indicates a cloud layer where icing may be possible. The risk depends on many factors, including cloud type, liquid water content, droplet size, vertical motion, aircraft characteristics, exposure time, and current weather advisories.
Layered clouds in stable air can support icing over broad areas. Cumuliform clouds may contain stronger vertical motion and localized icing intensity. Freezing drizzle and supercooled large droplets are particularly serious hazards, but diagnosing those conditions requires specialized forecast products and careful weather analysis. Pilots should not rely on a Skew-T alone to rule out or confirm these hazards.
The vertical depth of subfreezing cloud matters operationally. A shallow cloud layer between the freezing level and cloud top may allow a properly equipped aircraft to minimize exposure, if legal, safe, and within performance capability. A deep saturated layer extending through a broad subfreezing temperature range may offer few escape options, especially for aircraft without certified ice protection or for pilots without appropriate training and operating procedures.
A Skew-T can also reveal warm layers aloft over cold surface air. This pattern may support mixed precipitation, freezing rain, or freezing drizzle depending on the depth and temperature of each layer. From a flight planning standpoint, the important lesson is that surface temperature alone is not enough. The vertical temperature profile determines whether precipitation falls as rain, snow, ice pellets, or freezing precipitation.
Winds Aloft, Wind Shear, and Turbulence Clues
Wind barbs along the side of a Skew-T can be as useful as the temperature and moisture traces. They show how wind direction and speed change with altitude. A strong increase in wind speed over a short vertical distance may indicate wind shear. A directional shift with height may also affect shear, turbulence, and storm organization.
For takeoff and landing, low-level wind shear is an obvious concern. A Skew-T may show a nocturnal low-level jet, a strong inversion with faster winds above it, or a frontal boundary with abrupt directional changes. These conditions can create mechanical or shear-induced turbulence even when the surface wind seems manageable.
For en route flight, winds aloft help pilots evaluate turbulence potential, groundspeed, fuel planning, and ride quality. Strong winds crossing mountain ranges can produce mountain wave activity when the broader pattern supports it. A Skew-T alone does not fully diagnose mountain waves, but it can show strong winds and stable layers that should prompt a pilot to review turbulence forecasts, mountain weather products, and pilot reports.
Convective turbulence is another area where the Skew-T provides clues. Steep low-level lapse rates, available moisture, and unstable layers may support bumpy air and convective cloud growth. If the wind profile also changes strongly with height, thunderstorms may become more organized. Pilots should use official convective outlooks and aviation weather products for thunderstorm decisions, but the Skew-T helps explain the vertical setup behind those forecasts.
How Pilots Should Use Skew-T Diagrams in Preflight Planning
A useful Skew-T review fits into a larger weather briefing rather than replacing it. Start with the big picture: surface analysis, fronts, pressure systems, radar, satellite imagery, and aviation forecasts. Then use the Skew-T to look vertically at the area and time most relevant to the flight.
Because soundings are location and time dependent, pilots should avoid treating one diagram as representative of an entire route. Atmospheric conditions can vary significantly over distance, terrain, water, fronts, and time. If your route crosses a front, a mountain range, a lake-effect region, or a coastal boundary, one sounding may not tell the whole story. Compare multiple locations and forecast times when available.
When reviewing a Skew-T for a planned flight, look for the aviation layers that matter most. Identify the surface temperature and dew point. Look for low-level saturation that may indicate fog or stratus. Estimate cloud bases and tops where possible. Locate the freezing level and any subfreezing saturated layers. Review winds aloft for shear or strong changes. Then compare your findings with METARs, TAFs, area forecasts, weather advisories, pilot reports, and radar or satellite trends.
One of the best uses of a Skew-T is to test whether the forecast makes physical sense. If the TAF calls for low ceilings and the Skew-T shows a saturated layer near the surface capped by an inversion, that adds confidence that the ceiling forecast has a reasonable atmospheric basis. If the forecast suggests improvement but the sounding shows a deep saturated layer with little drying, a cautious pilot may look for additional evidence before assuming conditions will improve quickly.
Common Mistakes or Misunderstandings
The first common mistake is treating a Skew-T as a precise cloud forecast. A Skew-T shows a vertical profile at a point and time, often based on observed or model data. It does not perfectly depict every cloud, precipitation band, or local terrain effect. Pilots should interpret it as one piece of evidence in a broader weather picture.
The second mistake is assuming that temperature and dew point lines must touch exactly for clouds to exist. In real atmospheric data, close spacing often matters more than exact contact. Measurement limitations, model smoothing, and chart resolution can all affect the appearance of the traces. A nearly saturated layer may still be operationally significant.
The third mistake is focusing on the freezing level alone when evaluating icing. The freezing level tells you where the air reaches 0 degrees Celsius, but icing risk depends on moisture, cloud structure, droplet characteristics, vertical motion, aircraft exposure, and escape options. A dry subfreezing layer may not present icing by itself. A moist subfreezing cloud layer deserves far more attention.
The fourth mistake is ignoring time. A morning sounding may not represent afternoon conditions after surface heating, frontal movement, sea breeze development, or terrain-driven circulation changes. Forecast soundings can be extremely useful, but they are still forecasts. The closer the data are to the actual route and departure time, the more useful they generally become.
The fifth mistake is using the diagram to justify a flight that other weather information already suggests is marginal. If AIRMETs, SIGMETs, pilot reports, freezing precipitation forecasts, convective weather, or low IFR conditions are present, a Skew-T should not be used selectively to explain them away. Good aeronautical decision-making weighs the most conservative credible interpretation, especially when the aircraft or pilot has limited weather capability.
Practical Example: A Winter IFR Training Flight
Consider an instrument student and instructor planning a winter training flight in a normally aspirated single-engine airplane. The route is 120 nautical miles between two airports with terrain that is not mountainous but includes rolling hills and limited alternate options. Surface observations show marginal VFR at departure, IFR ceilings near the destination, and temperatures slightly above freezing at the surface. The TAF indicates a chance of light precipitation and a broken ceiling during the planned arrival window.
A Skew-T near the departure area shows a shallow moist layer from the surface to about 2,500 feet MSL, then drier air above. The temperature in that shallow layer is above freezing. That suggests low clouds may exist near departure, but icing risk in the lowest cloud layer may be limited by temperature. Farther along the route, a forecast Skew-T near the destination shows a deeper saturated layer from roughly 1,500 feet through 8,000 feet MSL. The temperature crosses freezing near 3,000 feet, and much of the saturated layer above that is below freezing.
Operationally, that changes the discussion. The airplane may need to climb into a subfreezing cloud layer to complete the route and may also need to descend through that layer on the approach. If the aircraft is not approved or equipped for flight in icing conditions, and if current forecasts or pilot reports raise concern about icing, the flight may not be acceptable. Even if the airplane has some ice protection, the instructor must consider training value, escape routes, alternates, fuel, pilot workload, and the student’s experience.
The Skew-T does not make the go or no-go decision by itself. It helps the crew understand that the freezing level and saturated layer overlap in a way that could create icing exposure. The practical result might be delaying the flight, changing the route, choosing a lower-risk training profile, staying in the local area beneath the freezing level if conditions allow, or conducting ground training instead.
Best Practices for Pilots
The best way to learn Skew-T interpretation is to compare diagrams with real weather outcomes. Before a local flight, look at the forecast sounding. Note the expected cloud bases, cloud tops, freezing level, and winds aloft. After the flight, compare what you saw with the diagram, METARs, pilot reports, and radar or satellite imagery. Over time, the chart becomes less abstract and more operationally meaningful.
Pilots should also learn the limitations of the data source they are using. Observed soundings are often launched from specific stations at scheduled times, while forecast soundings are model-generated for selected locations and times. Each has strengths and limitations. Observed data can be highly valuable but may be geographically or temporally distant from the flight. Forecast data can be route-specific and time-specific, but model uncertainty must be respected.
Use Skew-T diagrams as a structured weather thinking tool. A short, practical scan can include:
- Identify surface temperature and dew point trends to assess fog, low cloud, and visibility concerns.
- Look for saturated or nearly saturated layers to estimate cloud depth and potential cloud tops.
- Find the freezing level and compare it with cloud layers to evaluate icing exposure.
- Review the lapse rate and inversions to understand stability, turbulence, and cloud type.
- Check wind barbs for wind shear, strong winds aloft, and major directional changes.
- Compare the Skew-T interpretation with official forecasts, advisories, radar, satellite imagery, and pilot reports.
For instructors, Skew-T diagrams are particularly useful during scenario-based training. Instead of asking students only whether the weather is legal, ask them to explain what the vertical profile suggests. Where are the clouds? Where is the freezing level? What altitude choices are realistic? What changes would make the flight safer? This approach builds weather judgment rather than rote briefing habits.
For instrument-rated pilots, the Skew-T can improve alternate planning. A destination may be forecast above minimums, but if the vertical profile suggests a deep moist layer, nearby alternates under the same air mass may not provide meaningful weather diversity. A better alternate may be one located in a different weather regime, beyond the front, outside the marine layer, or away from terrain-induced cloud and precipitation.
Training Value for Student Pilots and Instructors
Student pilots do not need to master advanced thermodynamics to benefit from Skew-T diagrams. At the private pilot level, the value is recognizing that weather changes with altitude and that ceilings, visibility, turbulence, and cloud development are connected to vertical temperature and moisture structure. This reinforces the habit of thinking in three dimensions.
Instrument students can go deeper. They should learn to connect Skew-T features with instrument flight decisions such as cruise altitude, route selection, missed approach risk, freezing-level avoidance, and alternate planning. They should also understand that legal IFR capability does not automatically make a flight safe if icing, embedded convection, low-level wind shear, or widespread low ceilings reduce escape options.
Commercial pilots, flight instructors, and serious cross-country pilots can use Skew-T analysis to sharpen weather judgment. The chart can help explain why a stable air mass produces widespread stratus, why a dry slot improves ceilings, why convective turbulence increases during afternoon heating, or why cloud tops matter as much as cloud bases in winter operations.
In recurrent training, instructors can present historical or simulated weather scenarios and ask pilots to identify risk areas. The purpose is not to create amateur forecasters. The purpose is to improve the pilot’s ability to interpret weather products, recognize uncertainty, and make conservative operational decisions when the atmosphere offers limited margins.
Frequently Asked Questions
Do pilots need to know how to read Skew-T Log-P diagrams?
Pilots are not generally expected to perform professional meteorological analysis, but learning the basics can improve weather understanding and decision-making. A Skew-T is especially useful for evaluating cloud layers, stability, freezing levels, icing potential, and winds aloft as part of a complete preflight weather review.
Can a Skew-T tell me exactly where the clouds will be?
No. A Skew-T can suggest likely cloud layers by showing where temperature and dew point are close together, but it is not a precise cloud map. Local terrain, lift, time of day, frontal movement, and data limitations all affect cloud formation. Always compare the diagram with METARs, TAFs, radar, satellite imagery, and pilot reports.
How can a Skew-T help with icing decisions?
A Skew-T helps by showing where visible moisture may overlap with subfreezing temperatures. If a saturated cloud layer exists below 0 degrees Celsius, icing may be possible. The chart should be used with icing forecasts, advisories, pilot reports, aircraft limitations, and conservative escape planning.
What is the most important feature for a beginner to look at?
Start with the temperature and dew point traces. Their spacing gives a quick indication of moisture and possible cloud layers. Then locate the freezing level and review winds aloft. Those three steps provide practical value before moving into more advanced stability analysis.
Are forecast Skew-T diagrams reliable enough for go or no-go decisions?
Forecast Skew-T diagrams can be very helpful, but they are model-based forecasts and should not be used alone. They are best used to understand possible vertical structure and to compare against official aviation weather products, current observations, and pilot reports.
What is the difference between stability and lapse rate?
Lapse rate describes how temperature changes with altitude. Stability describes how the atmosphere responds when air is lifted. A steep lapse rate often supports instability, while an inversion or weak lapse rate often supports stability, but moisture and lifting mechanisms also matter.
Key Takeaways
- Skew-T Log-P diagrams help pilots see the vertical structure of temperature, moisture, wind, clouds, and freezing levels.
- Icing potential becomes more concerning when saturated cloud layers overlap with subfreezing temperatures and limited escape options.
- Use Skew-T analysis as part of a complete aviation weather briefing, not as a substitute for official forecasts, advisories, pilot reports, and sound judgment.