
Chapter 11
Aircraft Performance
Region of Reversed Command
The aerodynamic properties of an aircraft generally determine the power requirements at various conditions of flight, while the powerplant capabilities generally determine the power available at various conditions of flight. When an aircraft is in steady, level flight, a condition of equilibrium must prevail. An unaccelerated condition of flight is achieved when lift equals weight, and the powerplant is set for thrust equal to drag. The power required to achieve equilibrium in constant-altitude flight at various airspeeds is depicted on a power required curve. The power required curve illustrates the fact that at low airspeeds near the stall or minimum controllable airspeed, the power setting required for steady, level flight is quite high.
Flight in the region of normal command means that while holding a constant altitude, a higher airspeed requires a higher power setting and a lower airspeed requires a lower power setting. The majority of aircraft flying (climb, cruise, and maneuvers) is conducted in the region of normal command.
Flight in the region of reversed command means flight in which a higher airspeed requires a lower power setting and a lower airspeed requires a higher power setting to hold altitude. It does not imply that a decrease in power produces lower airspeed. The region of reversed command is encountered in the low speed phases of flight. Flight speeds below the speed for maximum endurance (lowest point on the power curve) require higher power settings with a decrease in airspeed. Since the need to increase the required power setting with decreased speed is contrary to the normal command of flight, the regime of flight speeds between the speed for minimum required power setting and the stall speed (or minimum control speed) is termed the region of reversed command. In the region of reversed command, a decrease in airspeed must be accompanied by an increased power setting in order to maintain steady flight.
curved line. Lower power settings, such as cruise power, would also appear in a similar curve. The lowest point on
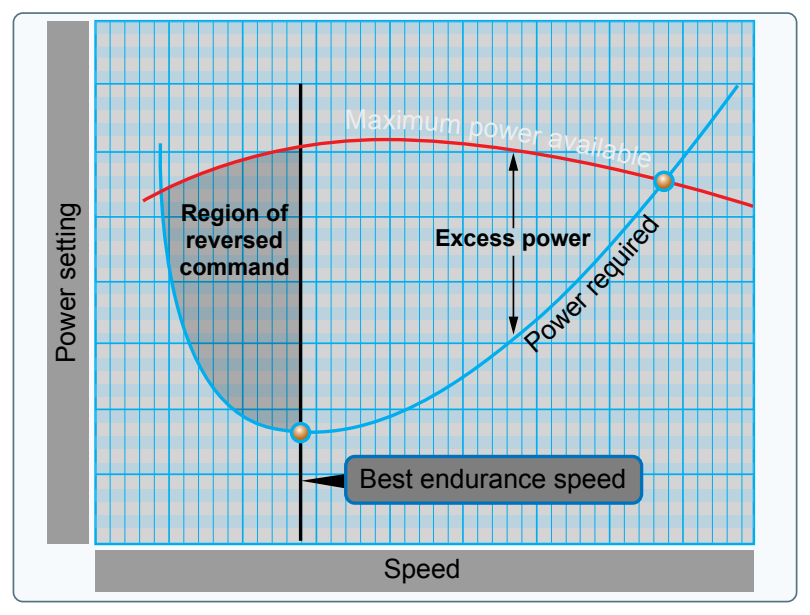
the power required curve represents the speed at which the lowest brake horsepower sustains level flight. This is termed the best endurance airspeed.
An airplane performing a low airspeed, high pitch attitude power approach for a short-field landing is an example of operating in the region of reversed command. If an unacceptably high sink rate should develop, it may be possible for the pilot to reduce or stop the descent by applying power. But without further use of power, the airplane would probably stall or be incapable of flaring for the landing. Merely lowering the nose of the airplane to regain flying speed in this situation, without the use of power, would result in a rapid sink rate and corresponding loss of altitude.
If during a soft-field takeoff and climb, for example, the pilot attempts to climb out of ground effect without first attaining normal climb pitch attitude and airspeed, the airplane may inadvertently enter the region of reversed command at a dangerously low altitude. Even with full power, the airplane may be incapable of climbing or even maintaining altitude. The pilot’s only recourse in this situation is to lower the pitch attitude in order to increase airspeed, which inevitably results in a loss of altitude.
Airplane pilots must give particular attention to precise control of airspeed when operating in the low flight speeds of the region of reversed command.
Takeoff and Landing Performance
The majority of pilot-caused aircraft accidents occur during the takeoff and landing phase of flight. Because of this fact, the pilot must be familiar with all the variables that influence the takeoff and landing performance of an aircraft and must strive for exacting, professional procedures of operation during these phases of flight.
Takeoff and landing performance is a condition of accelerated and decelerated motion. For instance, during takeoff an aircraft starts at zero speed and accelerates to the takeoff speed to become airborne. During landing, the aircraft touches down at the landing speed and decelerates to zero speed. The important factors of takeoff or landing performance are:
- The takeoff or landing speed is generally a function of the stall speed or minimum flying speed.
- The rate of acceleration/deceleration during the takeoff or landing roll. The speed (acceleration and deceleration) experienced by any object varies directly with the imbalance of force and inversely with the mass of the object. An airplane on the runway moving at 75 knots has four times the energy it has traveling at 37 knots. Thus, an airplane requires four times as much distance to stop as required at half the speed.
- The takeoff or landing roll distance is a function of both acceleration/deceleration and speed.
Runway Surface and Gradient
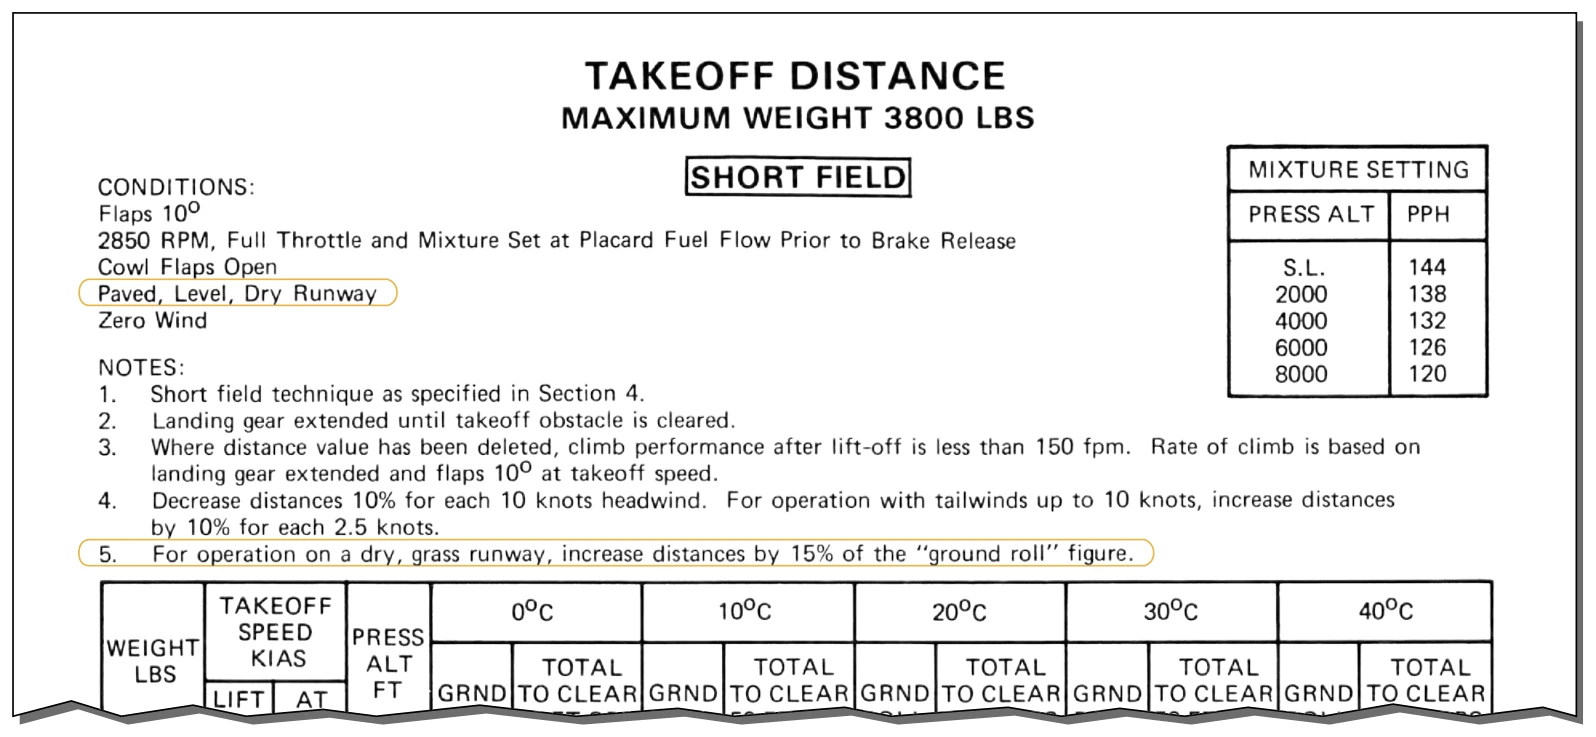
Runway conditions affect takeoff and landing performance. Typically, performance chart information assumes paved, level, smooth, and dry runway surfaces. Since no two runways are alike, the runway surface differs from one runway to another, as does the runway gradient or slope. [Figure 11-15]
Runway surfaces vary widely from one airport to another. The runway surface encountered may be concrete, asphalt, gravel, dirt, or grass. The runway surface for a specific airport is noted in the Chart Supplement U.S. (formerly Airport/Facility Directory). Any surface that is not hard and smooth increases the ground roll during takeoff. This is due to the inability of the tires to roll smoothly along the runway. Tires can sink into soft, grassy, or muddy runways. Potholes or other ruts in the pavement can be the cause of poor tire movement along the runway. Obstructions such as mud, snow, or standing water reduce the airplane’s acceleration down the runway. Although muddy and wet surface conditions can reduce friction between the runway and the tires, they can also act as obstructions and reduce the landing distance. [Figure 11-16] Braking effectiveness is another consideration when dealing with various runway types. The condition of the surface affects the braking ability of the aircraft.
The amount of power that is applied to the brakes without skidding the tires is referred to as braking effectiveness. Ensure that runways are adequate in length for takeoff acceleration and landing deceleration when less than ideal surface conditions are being reported.
The gradient or slope of the runway is the amount of change in runway height over the length of the runway. The gradient is expressed as a percentage, such as a 3 percent gradient. This means that for every 100 feet of runway length, the runway height changes by 3 feet. A positive gradient indicates the runway height increases, and a negative gradient indicates the runway decreases in height. An upsloping runway impedes acceleration and results in a longer ground run during takeoff. However, landing on an upsloping runway typically reduces the landing roll. A downsloping runway aids in acceleration on takeoff resulting in shorter takeoff distances. The opposite is true when landing, as landing on a downsloping runway increases landing distances. Runway slope information is contained in the Chart Supplement U.S. (formerly Airport/ Facility Directory). [Figure 11-17]