
Chapter 11
Aircraft Performance
Each aircraft performs differently and, therefore, has different performance numbers. Compute the performance of the aircraft prior to every flight, as every flight is different. (See appendix for examples of performance charts for a Cessna Model 172R and Challenger 605.)
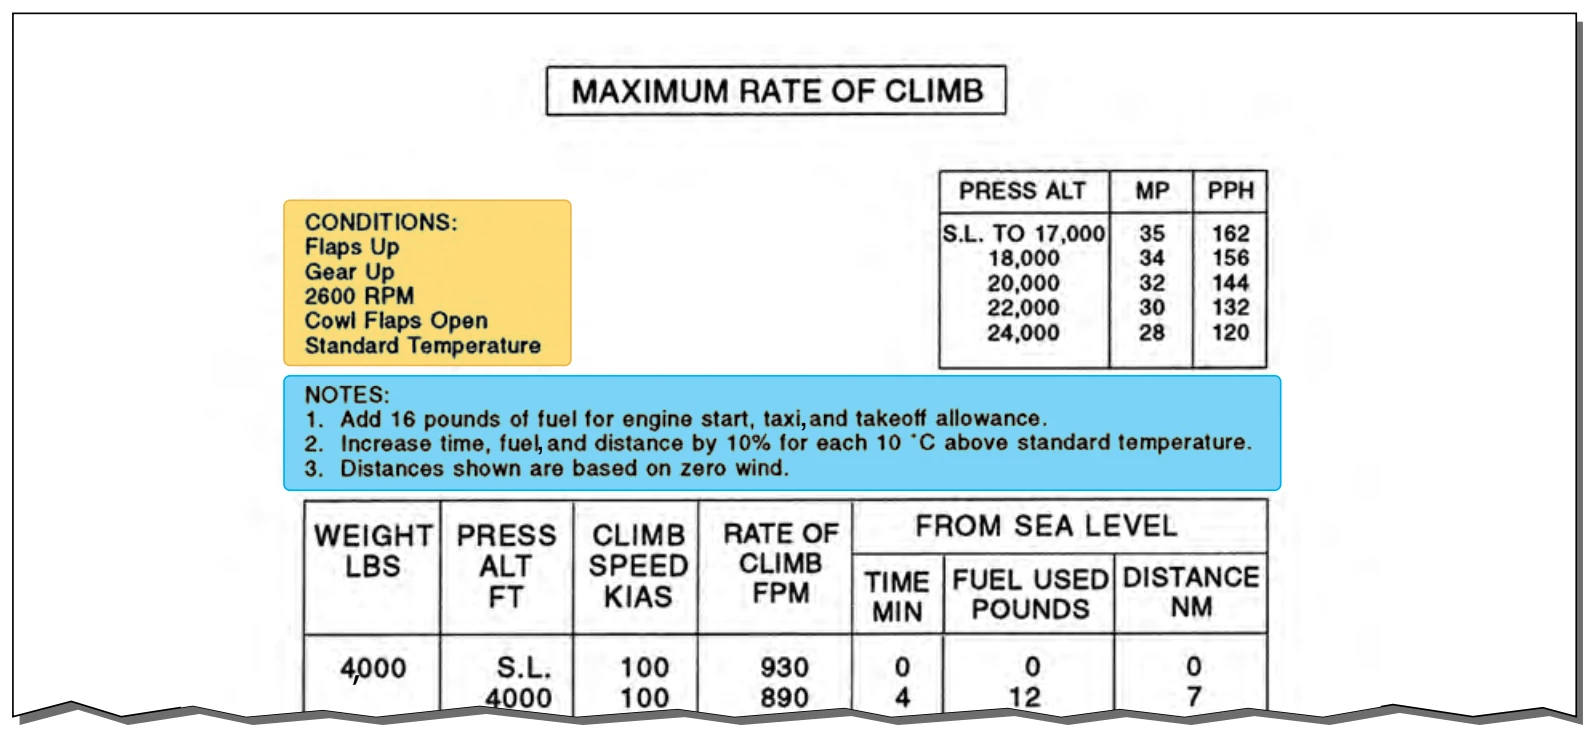
Every chart is based on certain conditions and contains notes on how to adapt the information for flight conditions. It is important to read every chart and understand how to use it. Read the instructions provided by the manufacturer. For an explanation on how to use the charts, refer to the example provided by the manufacturer for that specific chart. [Figure 11-20]
The information manufacturers furnish is not standardized. Information may be contained in a table format and other information may be contained in a graph format. Sometimes combined graphs incorporate two or more graphs into one chart to compensate for multiple conditions of flight. Combined graphs allow the pilot to predict aircraft performance for variations in density altitude, weight, and winds all on one chart. Because of the vast amount of information that can be extracted from this type of chart, it is important to be very accurate in reading the chart. A small error in the beginning can lead to a large error at the end.
The remainder of this section covers performance information for aircraft in general and discusses what information the charts contain and how to extract information from the charts by direct reading and interpolation methods. Every chart contains a wealth of information that should be used when flight planning. Examples of the table, graph, and combined graph formats for all aspects of flight are discussed.
Interpolation
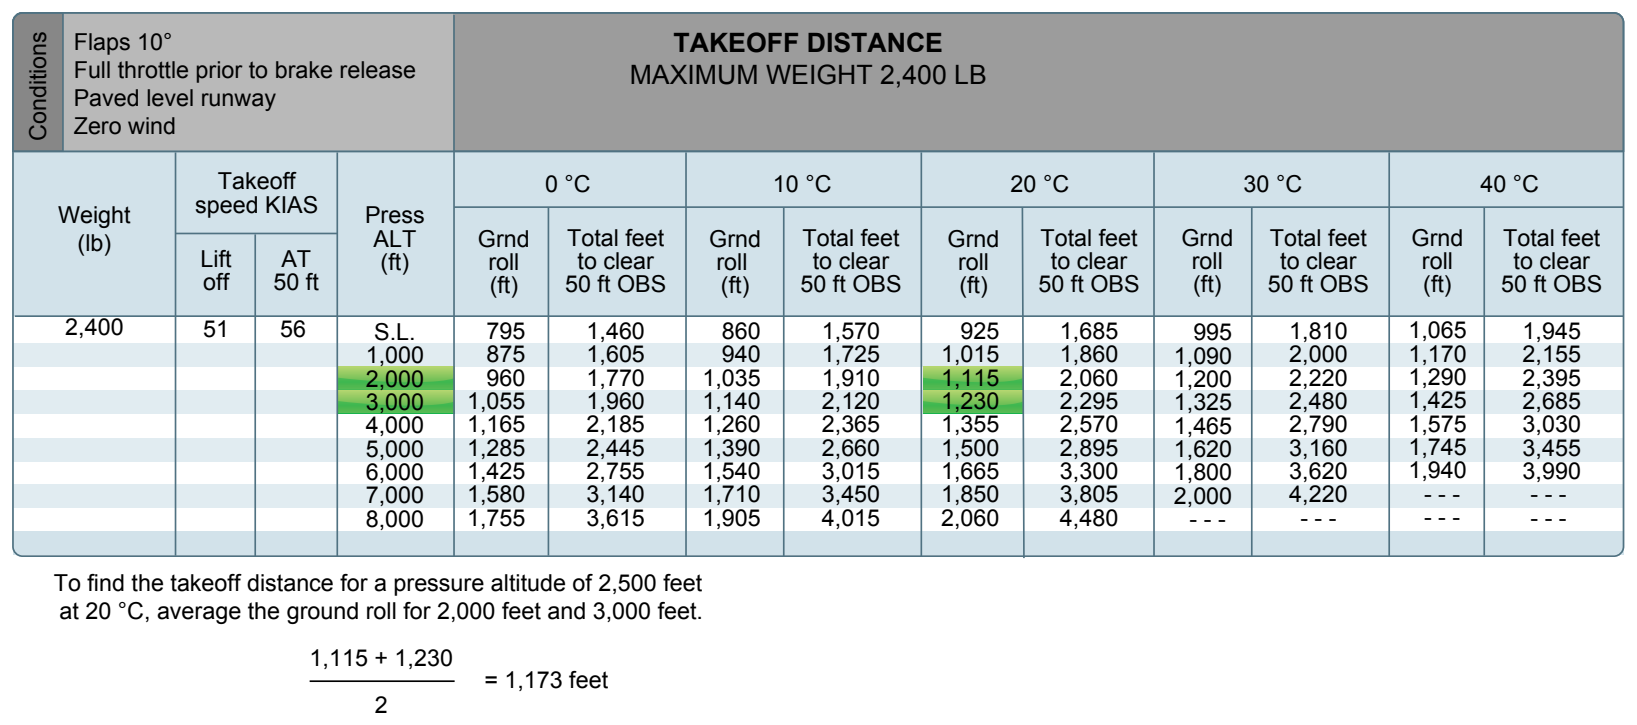
Not all of the information on the charts is easily extracted. Some charts require interpolation to find the information for specific flight conditions. Interpolating information means that by taking the known information, a pilot can compute intermediate information. However, pilots sometimes round off values from charts to a more conservative figure.
Using values that reflect slightly more adverse conditions provides a reasonable estimate of performance information and gives a slight margin of safety. The following illustration is an example of interpolating information from a takeoff distance chart. [Figure 11-21]
Density Altitude Charts
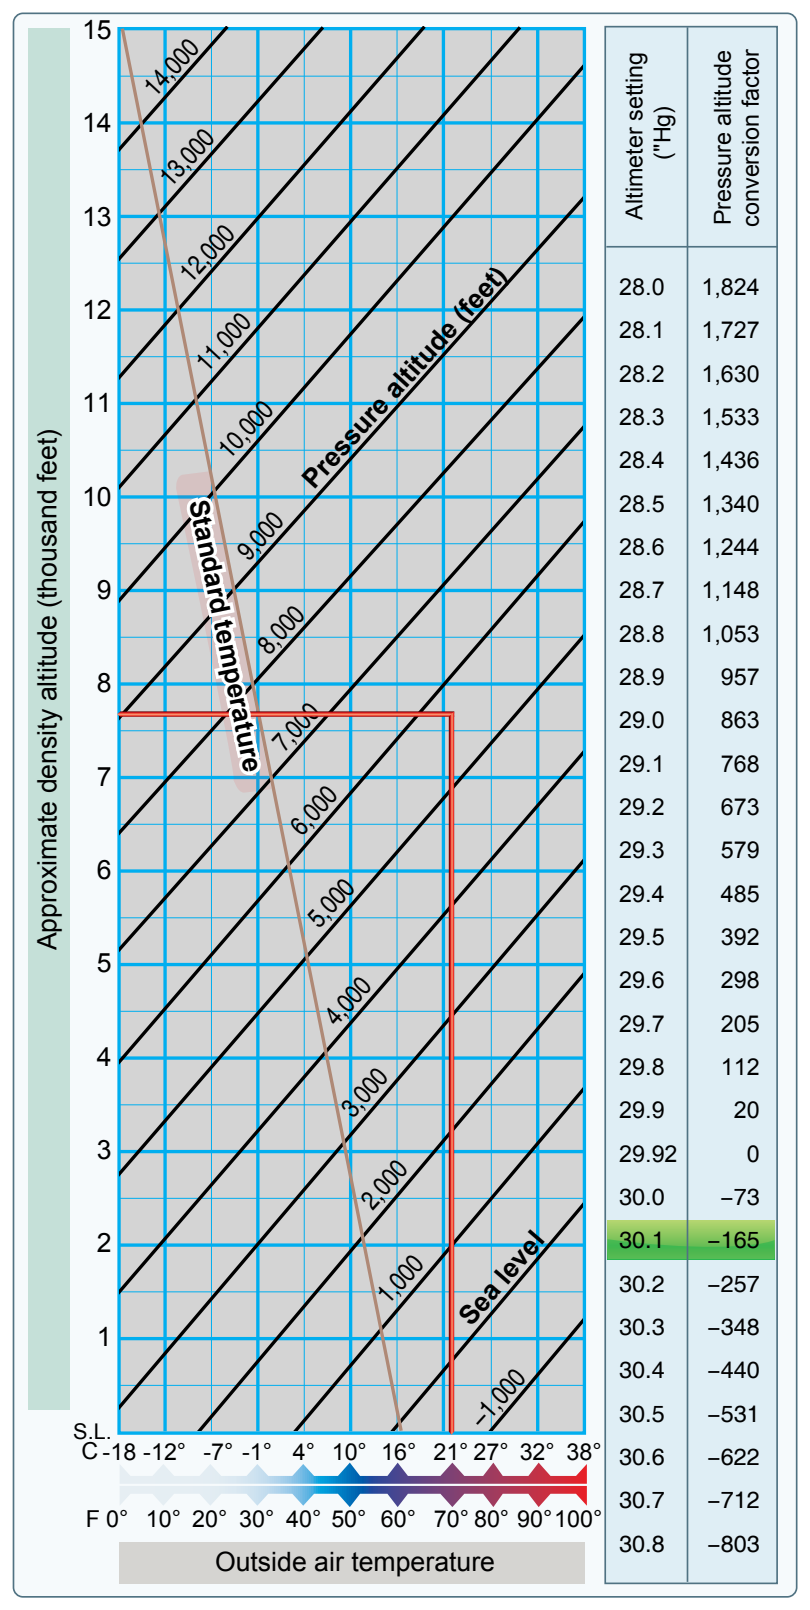
Use a density altitude chart to figure the density altitude at the departing airport. Using Figure 11-22, determine the density altitude based on the given information.
Sample Problem 1 Airport Elevation...............................................5,883 feet OAT...........................................................................70 °F Altimeter...........................................................30.10 "Hg
First, compute the pressure altitude conversion. Find 30.10 under the altimeter heading. Read across to the second column. It reads “-165.” Therefore, it is necessary to subtract 165 from the airport elevation giving a pressure altitude of 5,718 feet. Next, locate the outside air temperature on the scale along the bottom of the graph. From 70°, draw a line up to the 5,718 feet pressure altitude line, which is about two-thirds of the way up between the 5,000 and 6,000 foot lines. Draw a line straight across to the far left side of the graph and read the approximate density altitude. The approximate density altitude in thousands of feet is 7,700 feet.
Takeoff Charts
Takeoff charts are typically provided in several forms and allow a pilot to compute the takeoff distance of the aircraft with no flaps or with a specific flap configuration. A pilot can also compute distances for a no flap takeoff over a 50 foot obstacle scenario, as well as with flaps over a 50 foot obstacle. The takeoff distance chart provides for various aircraft weights, altitudes, temperatures, winds, and obstacle heights.
Sample Problem 2 Pressure Altitude...............................................2,000 feet OAT..........................................................................22 °C Takeoff Weight.............................................2,600 pounds Headwind...............................................................6 knots Obstacle Height.......................................50 foot obstacle
Refer to Figure 11-23. This chart is an example of a combined takeoff distance graph. It takes into consideration pressure altitude, temperature, weight, wind, and obstacles all on one chart. First, find the correct temperature on the bottom left side of the graph. Follow the line from 22 °C straight up until it intersects the 2,000 foot altitude line. From that point, draw a line straight across to the first dark reference line. Continue to draw the line from the reference point in a diagonal direction following the surrounding lines until it intersects the corresponding weight line. From the intersection of 2,600 pounds, draw a line straight across until it reaches the second reference line. Once again, follow the lines in a diagonal manner until it reaches the six knot headwind mark. Follow
straight across to the third reference line and from here, draw a line in two directions. First, draw a line straight across to figure the ground roll distance. Next, follow the diagonal lines again until they reach the corresponding obstacle height. In this case, it is a 50 foot obstacle. Therefore, draw the diagonal line to the far edge of the chart. This results in a 700 foot ground roll distance and a total distance of 1,400 feet over a 50 foot obstacle. To find the corresponding takeoff speeds at lift-off and over the 50 foot obstacle, refer to the table on the top of the chart. In this case, the lift-off speed at 2,600 pounds would be 63 knots and over the 50 foot obstacle would be 68 knots.
Sample Problem 3 Pressure Altitude...............................................3,000 feet OAT.........................................................................30 °C Takeoff Weight............................................2,400 pounds Headwind............................................................18 knots