
Chapter 11
Aircraft Performance
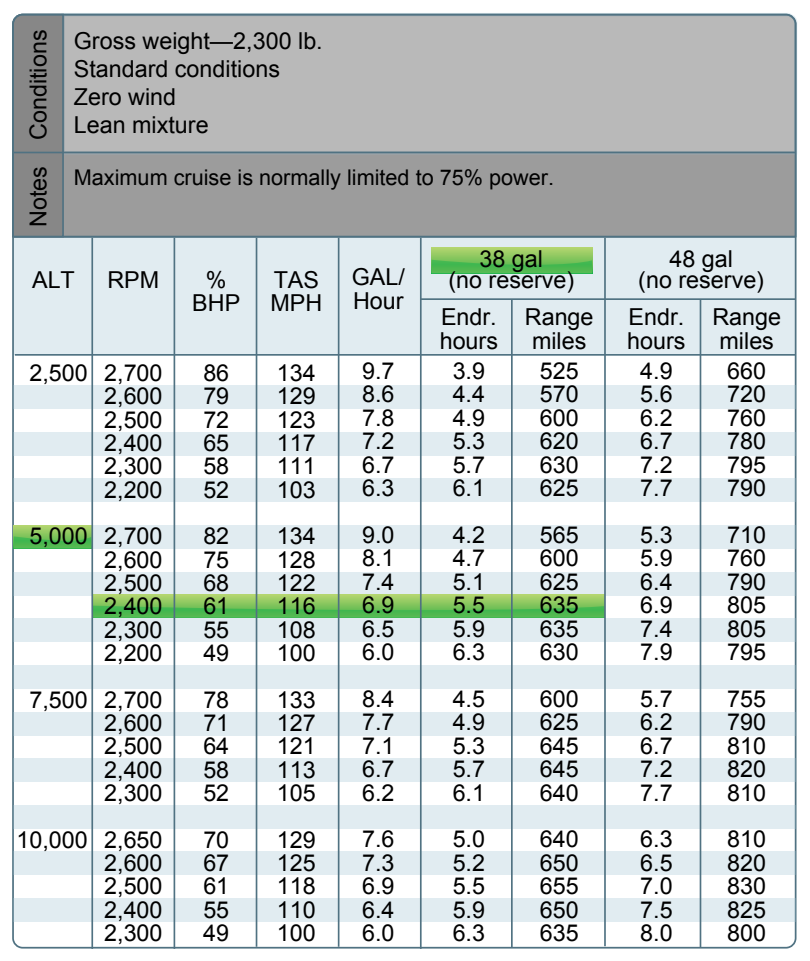
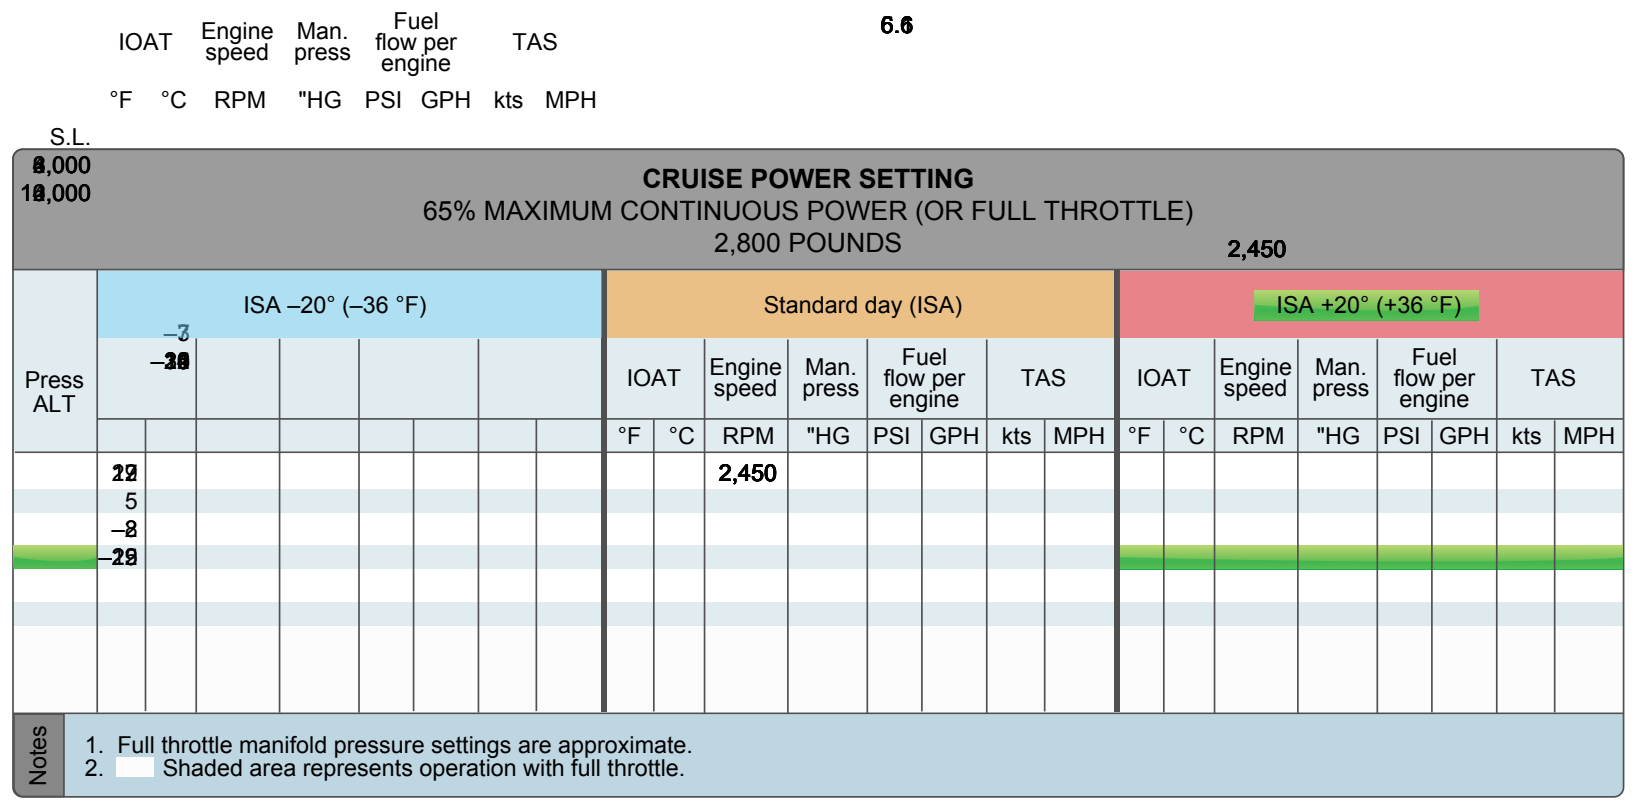
Another type of cruise chart is a best power mixture range graph. This graph gives the best range based on power setting and altitude. Using Figure 11-29, find the range at 65 percent power with and without a reserve based on the provided conditions.
Sample Problem 8 OAT....................................................................Standard Pressure Altitude...............................................5,000 feet
First, move up the left side of the graph to 5,000 feet and standard temperature. Follow the line straight across the graph until it intersects the 65 percent line under both the reserve and no reserve categories. Draw a line straight down from both intersections to the bottom of the graph. At 65 percent power with a reserve, the range is approximately 522 miles. At 65 percent power with no reserve, the range should be 581 miles.
The last cruise chart referenced is a cruise performance graph. This graph is designed to tell the TAS performance of the airplane depending on the altitude, temperature, and power setting. Using Figure 11-30, find the TAS performance based on the given information.
Sample Problem 9 OAT.........................................................................16 °C Pressure Altitude...............................................6,000 feet Power Setting................................65 percent, best power Wheel Fairings..............................................Not installed
Begin by finding the correct OAT on the bottom left side of the graph. Move up that line until it intersects the pressure altitude of 6,000 feet. Draw a line straight across to the
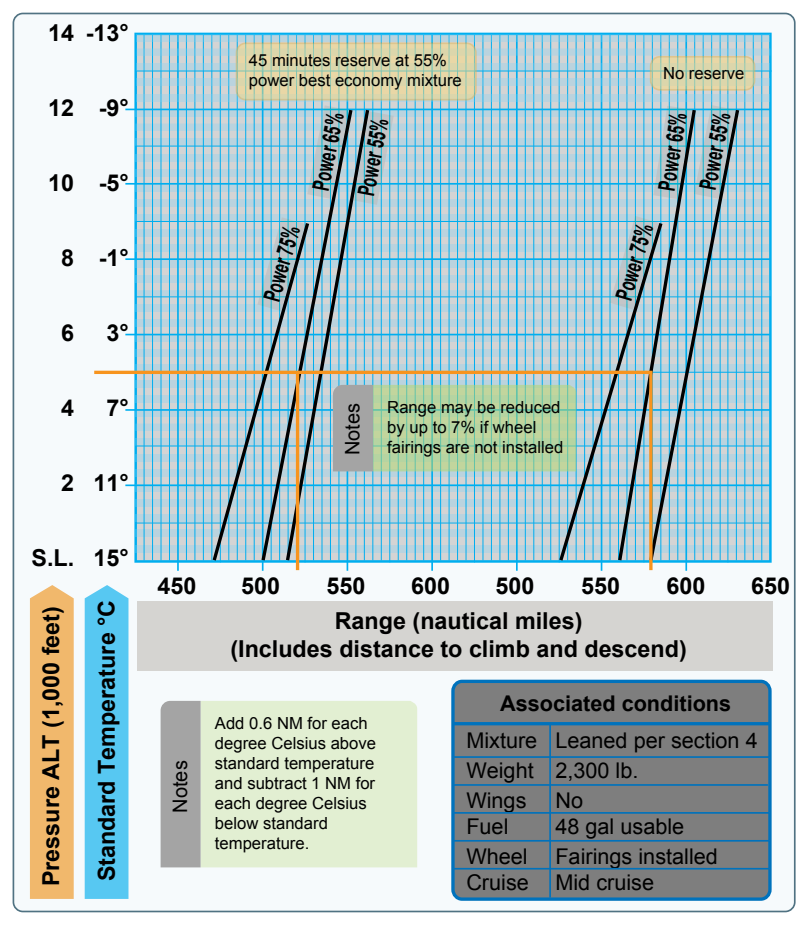
65 percent, best power line. This is the solid line, that represents best economy. Draw a line straight down from this intersection to the bottom of the graph. The TAS at 65 percent best power is 140 knots. However, it is necessary to subtract 8 knots from the speed since there are no wheel fairings. This note is listed under the title and conditions. The TAS is 132 knots.
Crosswind and Headwind Component Chart
Every aircraft is tested according to Federal Aviation Administration (FAA) regulations prior to certification. The aircraft is tested by a pilot with average piloting skills in 90° crosswinds with a velocity up to 0.2 VS0 or two-tenths of the aircraft’s stalling speed with power off, gear down, and flaps down. This means that if the stalling speed of the aircraft is 45 knots, it must be capable of landing in a 9-knot, 90° crosswind. The maximum demonstrated crosswind component is published in the AFM/POH. The crosswind and headwind component chart allows for figuring the headwind and crosswind component for any given wind direction and velocity.
Sample Problem 10 Runway..........................................................................17 Wind........................................................140° at 25 knots
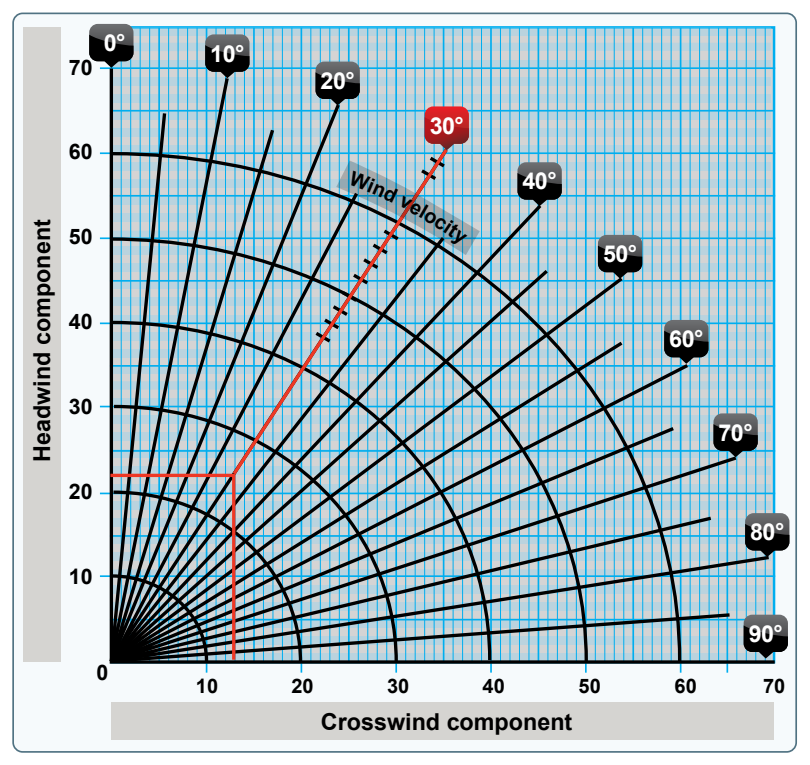
Refer to Figure 11-31 to solve this problem. First, determine how many degrees difference there is between the runway and the wind direction. It is known that runway 17 means a direction of 170°; from that subtract the wind direction of 140°. This gives a 30° angular difference or wind angle. Next, locate the 30° mark and draw a line from there until it intersects the correct wind velocity of 25 knots. From
there, draw a line straight down and a line straight across. The headwind component is 22 knots and the crosswind component is 13 knots. This information is important when taking off and landing so that, first of all, the appropriate runway can be picked if more than one exists at a particular airport, but also so that the aircraft is not pushed beyond its tested limits.
Landing Charts
Landing performance is affected by variables similar to those affecting takeoff performance. It is necessary to compensate for differences in density altitude, weight of the airplane, and headwinds. Like takeoff performance charts, landing distance information is available as normal landing information, as well as landing distance over a 50 foot obstacle. As
usual, read the associated conditions and notes in order to ascertain the basis of the chart information. Remember, when calculating landing distance that the landing weight is not the same as the takeoff weight. The weight must be recalculated to compensate for the fuel that was used during the flight.