
Chapter 12
Weather Theory
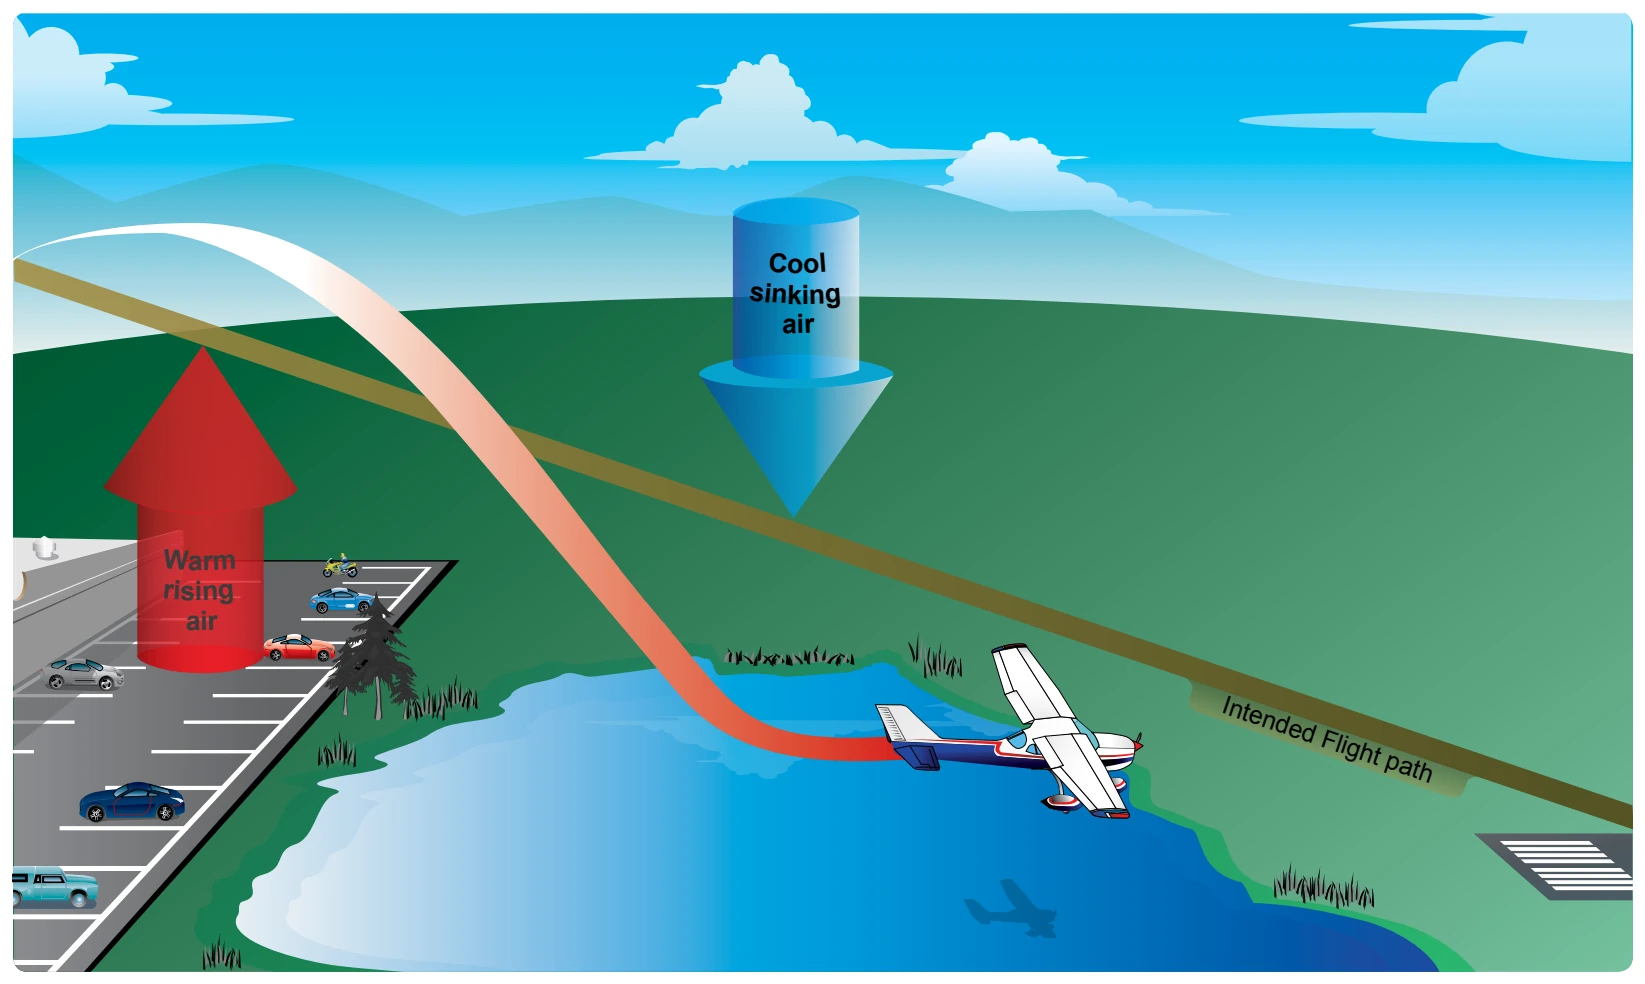
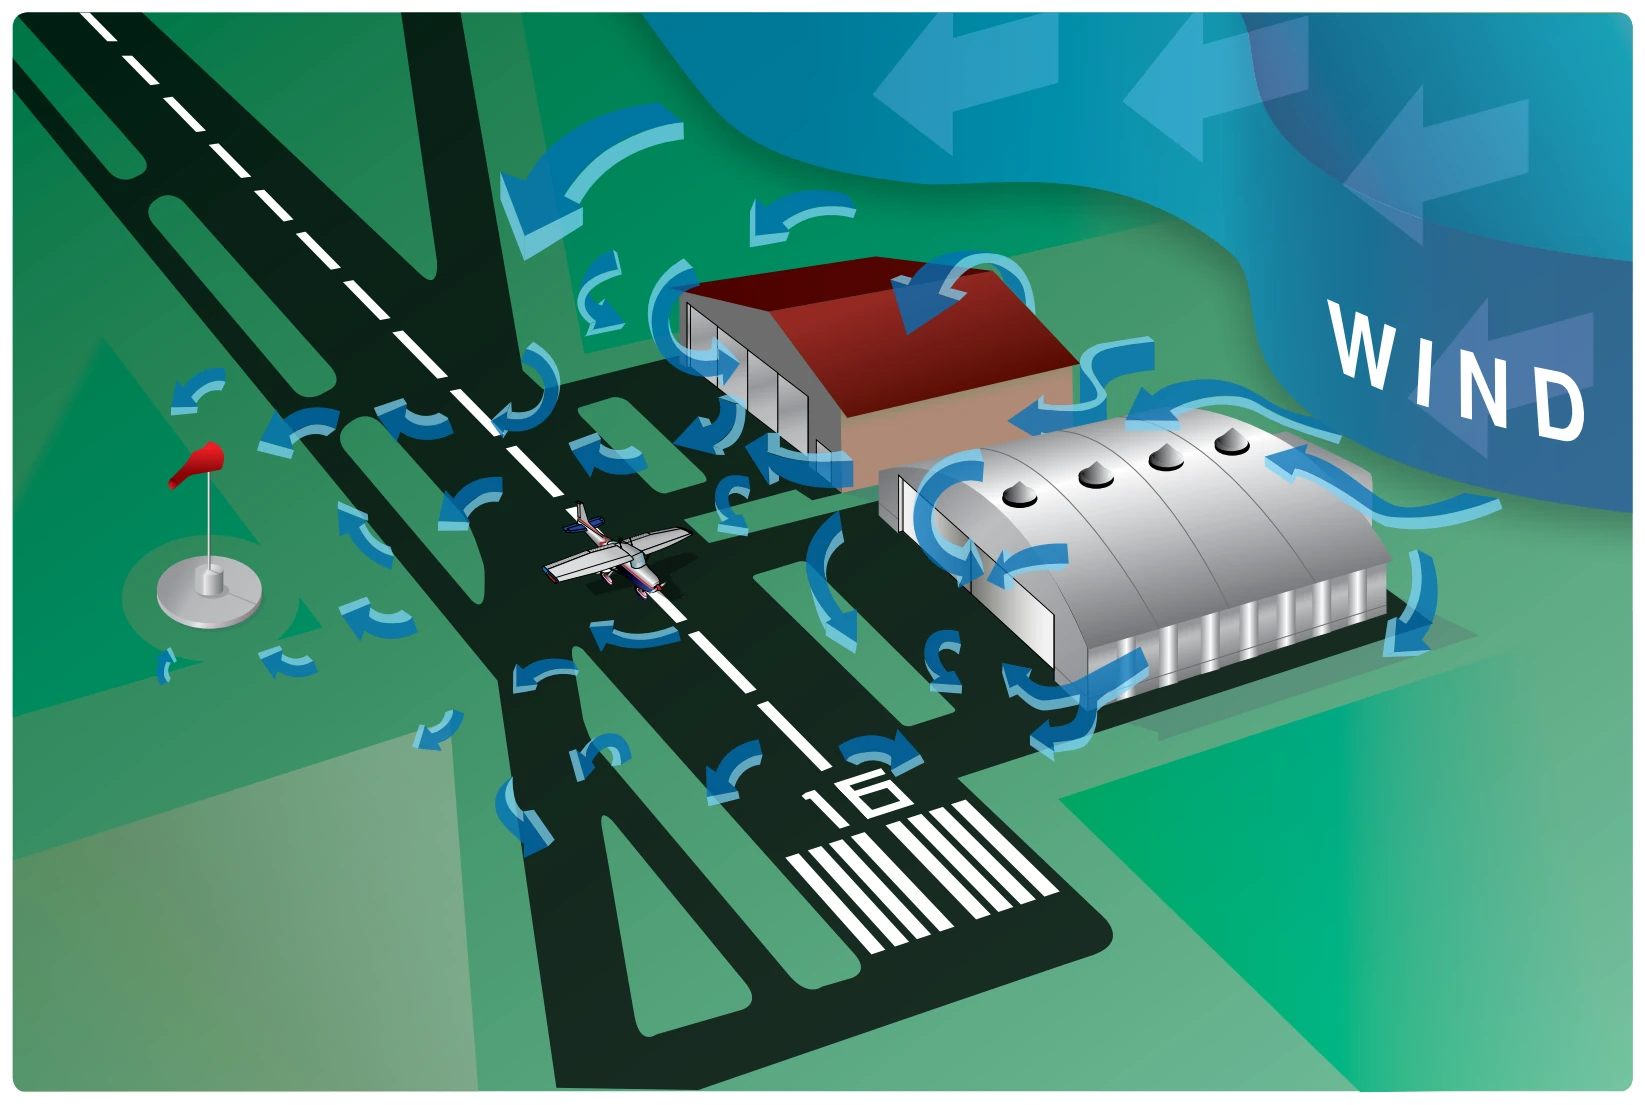
may “drop in” due to the turbulent air and be too low to clear obstacles during the approach.
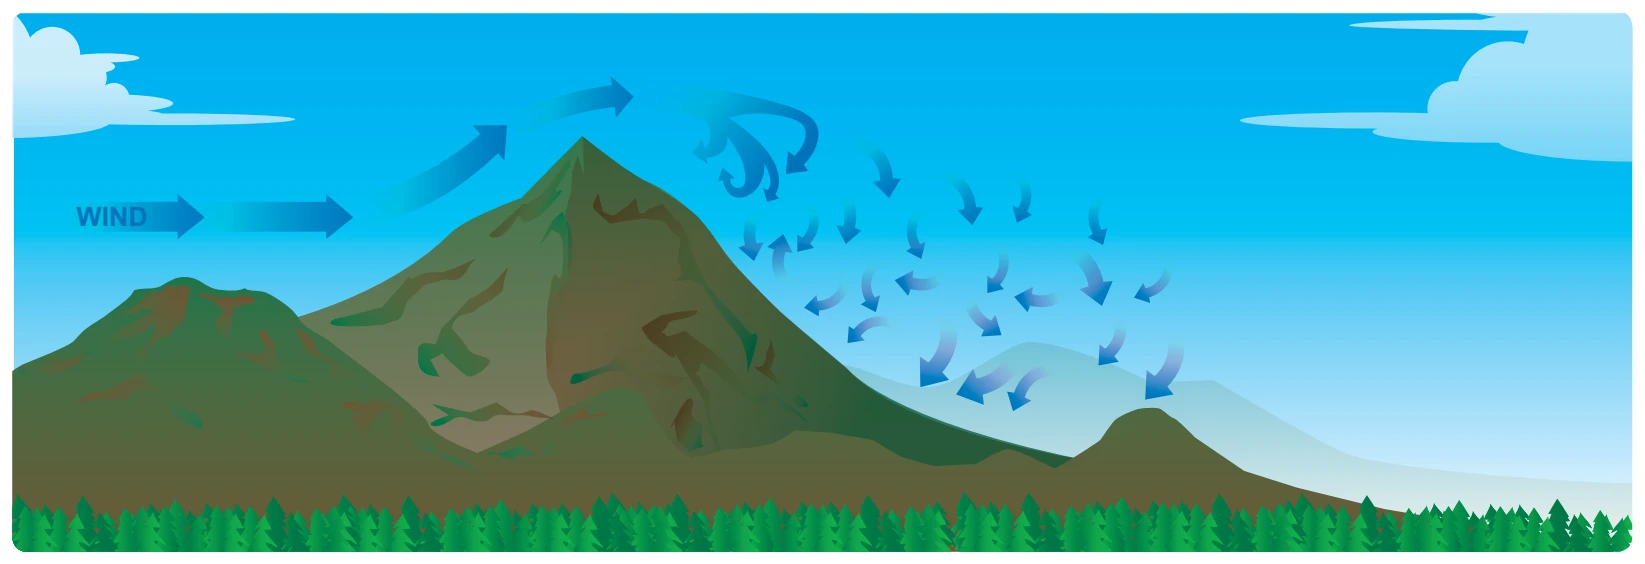
This same condition is even more noticeable when flying in mountainous regions. [Figure 12-16] While the wind flows smoothly up the windward side of the mountain and the upward currents help to carry an aircraft over the peak of the mountain, the wind on the leeward side does not act in a similar manner. As the air flows down the leeward side of the mountain, the air follows the contour of the terrain and is increasingly turbulent. This tends to push an aircraft into the side of a mountain. The stronger the wind, the greater the downward pressure and turbulence become.
Due to the effect terrain has on the wind in valleys or canyons, downdrafts can be severe. Before conducting a flight in or
near mountainous terrain, it is helpful for a pilot unfamiliar with a mountainous area to get a checkout with a mountain qualified flight instructor.
Low-Level Wind Shear
Wind shear is a sudden, drastic change in wind speed and/or direction over a very small area. Wind shear can subject an aircraft to violent updrafts and downdrafts, as well as abrupt changes to the horizontal movement of the aircraft. While wind shear can occur at any altitude, low-level wind shear is especially hazardous due to the proximity of an aircraft to the ground. Low-level wind shear is commonly associated with passing frontal systems, thunderstorms, temperature inversions, and strong upper level winds (greater than 25 knots).
Wind shear is dangerous to an aircraft. It can rapidly change the performance of the aircraft and disrupt the normal flight attitude. For example, a tailwind quickly changing to a headwind causes an increase in airspeed and performance. Conversely, a headwind changing to a tailwind causes a decrease in airspeed and performance. In either case, a pilot must be prepared to react immediately to these changes to maintain control of the aircraft.
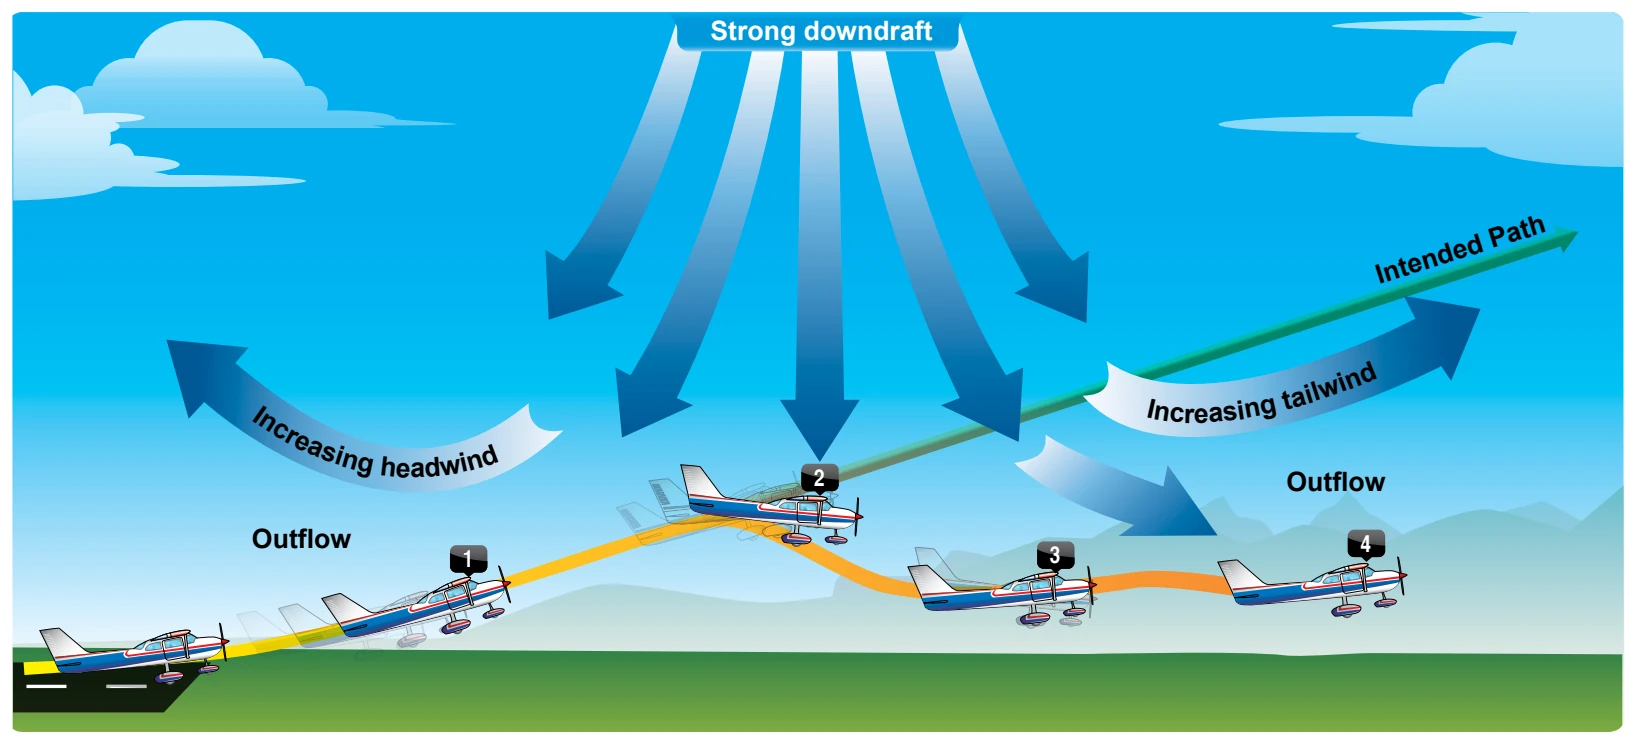
The most severe type of low-level wind shear, a microburst, is associated with convective precipitation into dry air at cloud base. Microburst activity may be indicated by an intense rain shaft at the surface but virga at cloud base and a ring of blowing dust is often the only visible clue. A typical microburst has a horizontal diameter of 1-2 miles and a nominal depth of 1,000 feet. The lifespan of a microburst is about 5-15 minutes during which time it can produce downdrafts of up to 6,000 feet per minute (fpm) and headwind losses of 30-90 knots, seriously degrading performance. It can also produce strong turbulence and hazardous wind direction changes. Consider Figure 12-17: During an inadvertent takeoff into a microburst, the plane may first experience a performance-increasing headwind (1), followed by performance-decreasing downdrafts (2), followed by a rapidly increasing tailwind (3). This can result in terrain impact or flight dangerously close to the ground (4). An encounter during approach involves the same sequence of wind changes and could force the plane to the ground short of the runway.
The FAA has made a substantial investment in microburst accident prevention. The totally redesigned LLWAS-NE, the TDWR, and the ASR-9 WSP are skillful microburst alerting systems installed at major airports. These three systems were extensively evaluated over a 3-year period. Each was seen to issue very few false alerts and to detect microbursts well above the 90 percent detection requirement established by Congress. Many flights involve airports that lack microburst alert equipment, so the FAA has also prepared wind shear training material: Advisory Circular (AC) 00-54, FAA Pilot Wind Shear Guide. Included is information on how to recognize the risk of a microburst encounter, how to avoid an encounter, and the best flight strategy for successful escape should an encounter occur.
It is important to remember that wind shear can affect any flight and any pilot at any altitude. While wind shear may be reported, it often remains undetected and is a silent danger to aviation. Always be alert to the possibility of wind shear, especially when flying in and around thunderstorms and frontal systems.
Wind and Pressure Representation on Surface Weather Maps
Surface weather maps provide information about fronts, areas of high and low pressure, and surface winds and pressures for each station. This type of weather map allows pilots to see the locations of fronts and pressure systems, but more importantly, it depicts the wind and pressure at the surface for each location. For more information on surface analysis and weather depiction charts, see Chapter 13, Aviation Weather Services.
Wind conditions are reported by an arrow attached to the station location circle. [Figure 12-18] The station circle represents the head of the arrow, with the arrow pointing in the direction from which the wind is blowing. Winds are described by the direction from which they blow, thus a northwest wind means that the wind is blowing from the northwest toward the southeast. The speed of the wind is depicted by barbs or pennants placed on the wind line. Each barb represents a speed of ten knots, while half a barb is equal to five knots, and a pennant is equal to 50 knots.
The pressure for each station is recorded on the weather chart and is shown in mb. Isobars are lines drawn on the chart to depict lines of equal pressure. These lines result in a pattern that reveals the pressure gradient or change in pressure over distance. [Figure 12-19] Isobars are similar to contour lines on a topographic map that indicate terrain altitudes and slope steepness. For example, isobars that are closely spaced indicate a steep pressure gradient and strong winds prevail. Shallow gradients, on the other hand, are represented by isobars that are spaced far apart and are indicative of light winds. Isobars help identify low- and high-pressure systems, as well as the location of ridges and troughs. A high is an area of high pressure surrounded by lower pressure; a low is an area of low pressure surrounded by higher pressure. A ridge is an elongated area of high pressure, and a trough is an elongated area of low pressure.
Isobars furnish valuable information about winds in the first few thousand feet above the surface. Close to the ground,