
Chapter 13
Aviation Weather Services
potential delay when using in-cockpit NEXRAD capabilities, as the movement and/or intensification of weather could adversely affect safety of flight.
- Understand that the common perception of a “5-minute latency” with radar data is not always correct.
- Get your preflight weather briefing! Having in-cockpit weather capabilities does not circumvent the need for a complete weather briefing before takeoff.
- Use all appropriate sources of weather information to make in-flight decisions.
- Let your fellow pilots know about the limitations of in-cockpit NEXRAD.
NEXRAD Abnormalities
Although NEXRAD is a compilation of stations across the country, there can be abnormalities associated with the system. Some of the abnormalities are listed below.
- Ground clutter
- Strobes and spurious radar data
- Sun strobes, when the radar antenna points directly at the sun
- Interference from buildings or mountains that may cause shadows
- Military aircraft that deploy metallic dust and may reflect the radar signature
NEXRAD Limitations
In addition to the abnormalities listed, the NEXRAD system does have some specific limitations.
Base Reflectivity
The NEXRAD base reflectivity does not provide adequate information from which to determine cloud layers or type of precipitation with respect to hail versus rain. Therefore, a pilot may mistake rain for hail.
In addition, the base reflectivity is sampled at the minimum antenna elevation angle. With this minimum angle, an individual site cannot depict high altitude storms directly over the station. This leaves an area of null coverage if an adjacent site does not also cover the affected area.
Resolution Display
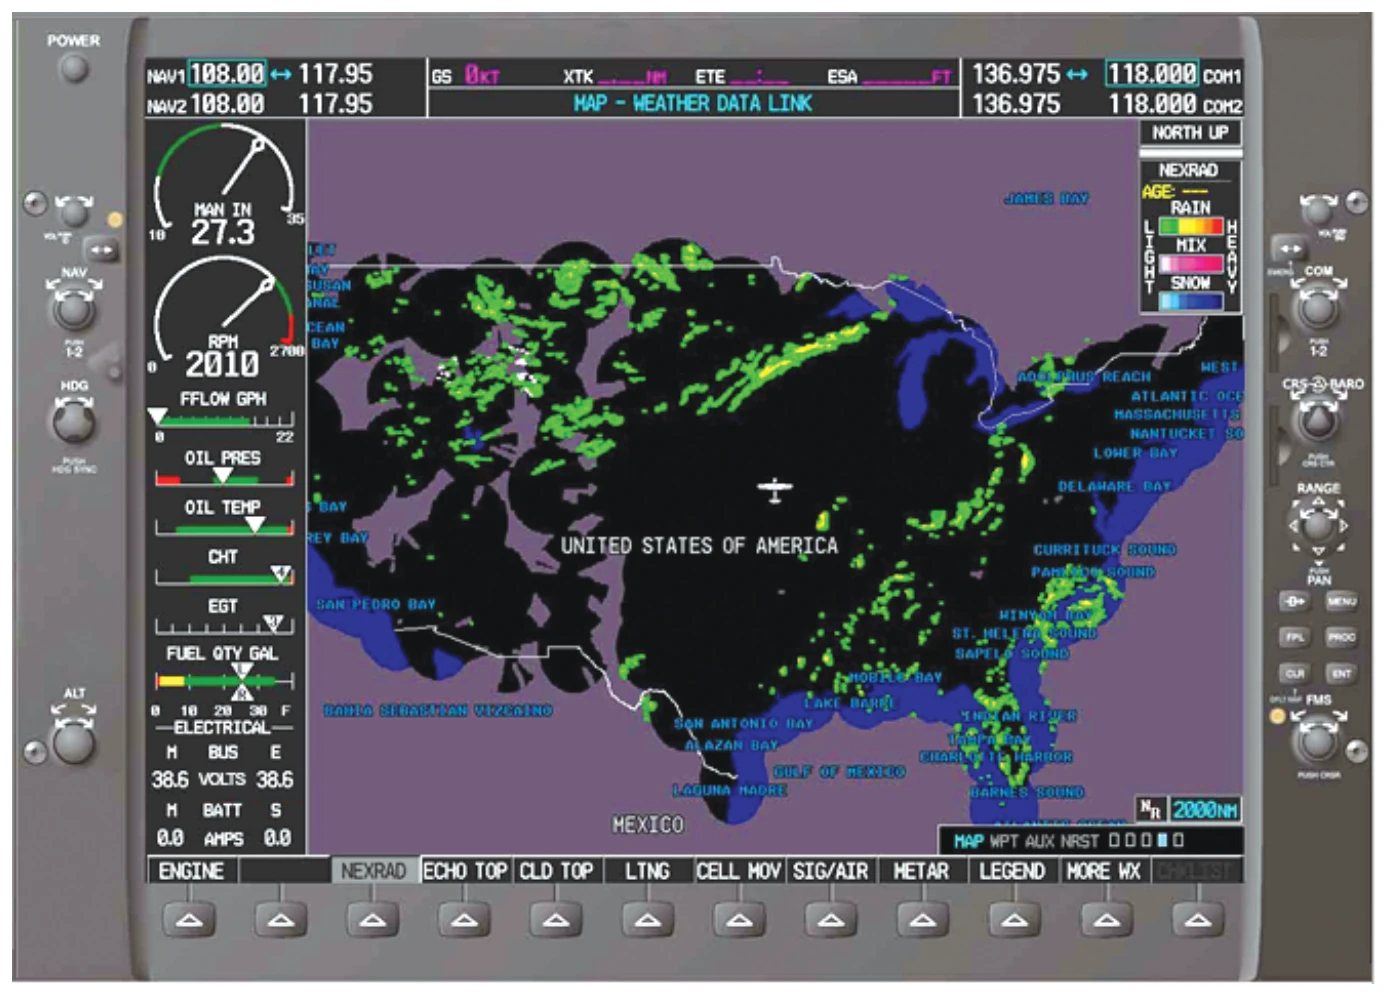
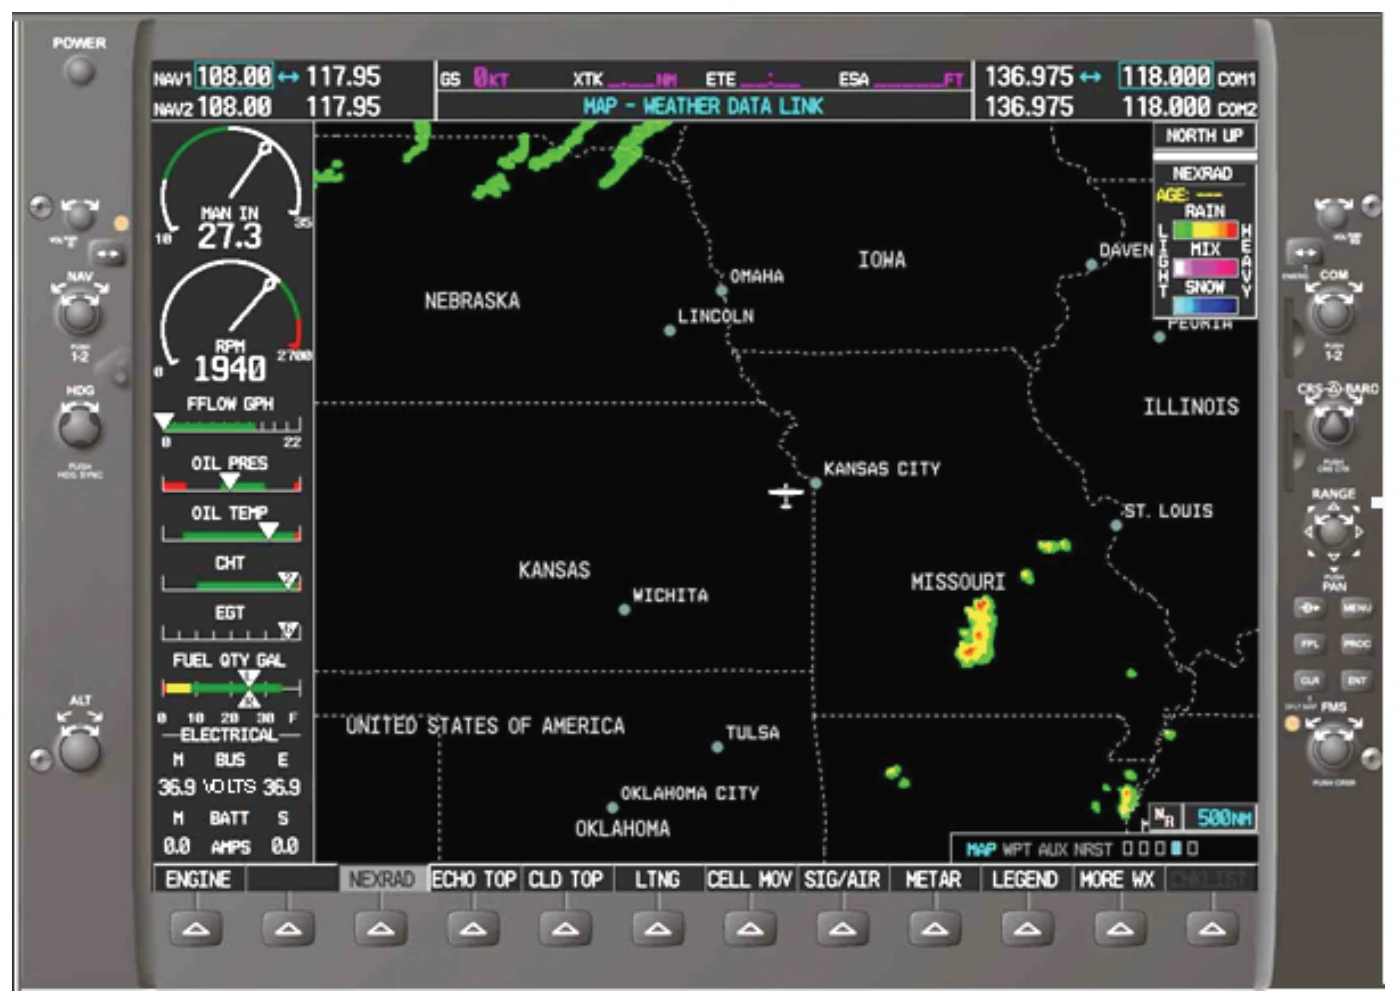
The resolution of the displayed data poses additional concerns when the range is decreased. The minimum resolution for NEXRAD returns is 1.24 miles. This means that when the display range is zoomed in to approximately ten miles, the individual square return boxes are more prevalent. Each square indicates the strongest display return within that 1.24 mile square area.
AIRMET/SIGMET Display
AIRMET/SIGMET information is available for the displayed viewing range on the MFD. Some displays are capable of displaying weather information for a 2,000 mile range. AIRMETS/SIGMETS are displayed by dashed lines on the map. [Figure 13-19]
The legend box denotes the various colors used to depict the AIRMETs, such as icing, turbulence, IFR weather, mountain obscuration, and surface winds. [Figure 13-20] The great advantage of the graphically displayed AIRMET/SIGMET boundary box is the pilot can see the extent of the area that the advisory covers. The pilot does not need to manually plot the points to determine the full extent of the coverage area.
Graphical METARs
METARs can be displayed on the MFD. Each reporting station that has a METAR/TAF available is depicted by a flag from the center of the airport symbol. Each flag is color coded to depict the type of weather that is currently reported at that station. A legend is available to assist users in determining what each flag color represents. [Figure 13-21]