
Chapter 4
Aircraft Drawings
Block diagrams are used to show a simplified relationship of a with during operation.
Wiring Diagrams
Wiring diagrams show the electrical wiring and circuitry, coded for identification, of all the electrical appliances and devices used on aircraft. [Figure 4-21] These diagrams, even for relatively simple circuits, can be quite complicated. For
Flowcharts
Flowcharts are used to illustrate a sequence or flow of events. There are two types of flow charts most frequently s.
Troubleshooting Flowchart
Troubleshooting flowcharts are frequently used for the detection of faulty components. They often consist of a series of yes or no questions. If the answer to a question is yes, one course of action is followed. If the answer is no, a different course of action is followed. In this simple manner, a logical solution to a problem may be achieved. Figure 4-22 shows a flow chart to determine the repair options for a composite structure.
Logic Flowchart
Another type of flowchart, developed specifically for analysis of digitally-controlled components and systems, is the logic flowchart. [Figure 4-23] A logic flowchart uses standardized symbols to indicate specific types of logic gates and their relationship to other digital devices in a system. Since digital systems make use of binary mathematics consisting of 1s and 0s, voltage or no voltage, a light pulse or no light pulse, and so forth, logic flowcharts consist of individual components that take an input and provide an output that is either the same as the input or opposite. By analyzing the input or multiple inputs, it is possible to determine the digital output or outputs.
mponents).
Lines and Their Meanings
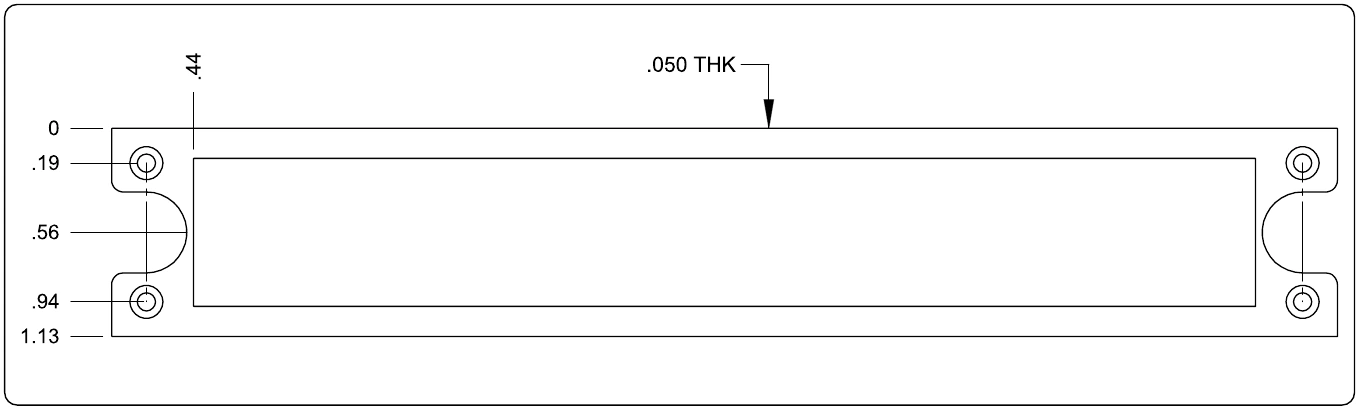
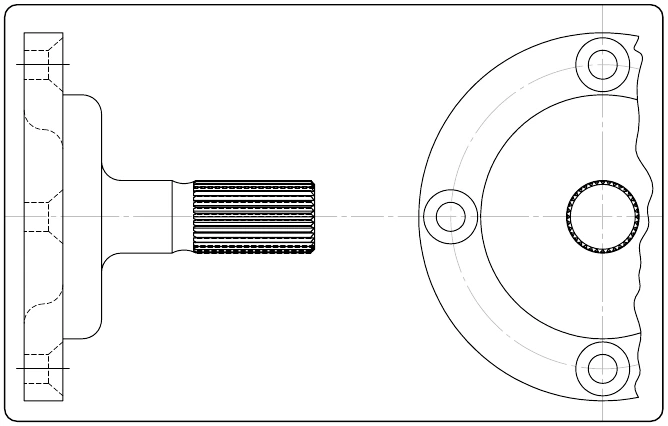
Every drawing is composed of lines. Lines mark the boundaries, edges, and intersection of surfaces. Lines are used to show dimensions and hidden surfaces and to indicate centers. Obviously, if the same kind of line is used to show these variations, a drawing becomes a meaningless collection of lines. For this reason, various kinds of standardized lines are used on aircraft drawings. [Figure 4-24] Examples of correct line uses are shown in Figure 4-25.
Most drawings use three widths, or intensities, of lines: thin, medium, or thick. These lines may vary somewhat on different drawings, but there is a noticeable difference between a thin and a thick line, with the width of the medium line somewhere between the two.