
Chapter 1
The National Airspace System
The profile view also depicts minimum, maximum, recommended, and mandatory block altitudes used in approaches. The minimum altitude is depicted with the altitude underscored (2500). On final approach, aircraft are required to maintain an altitude at or above the depicted altitude until reaching the subsequent fix. The maximum altitude is depicted with the altitude overscored (4300 ), and aircraft must remain at or below the depicted altitude. Mandatory altitudes are depicted with the altitude both underscored and overscored (5500), and altitude is to be maintained at the depicted value. Recommended altitudes are advisory altitudes and are neither over- nor underscored. When an over- or underscore spans two numbers, a mandatory block altitude is indicated, and aircraft are required to maintain altitude within the range of the two numbers. [Figures 1-11 and 1-12]
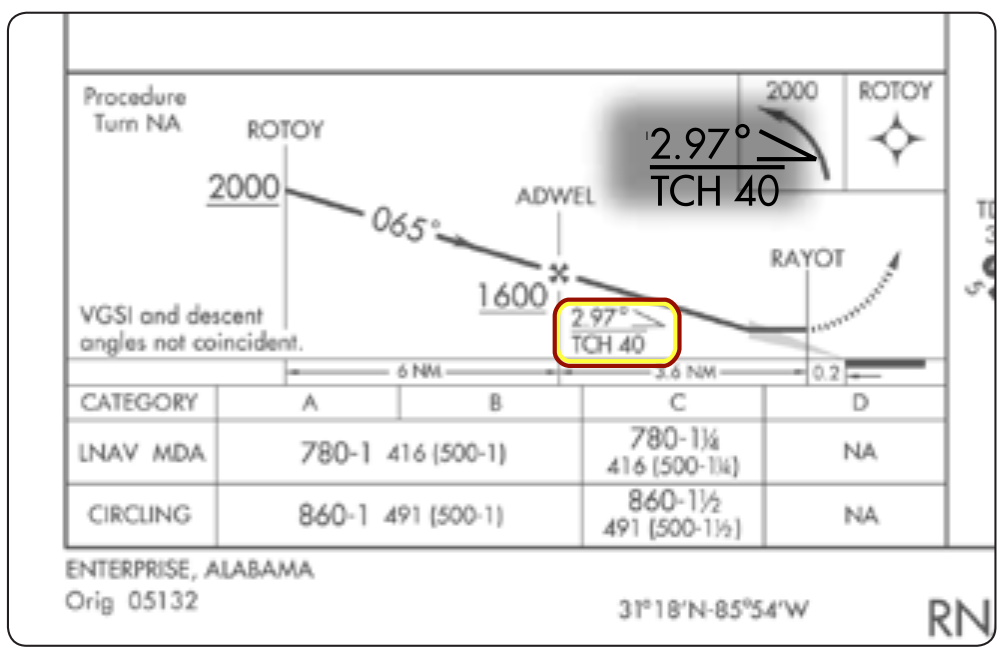
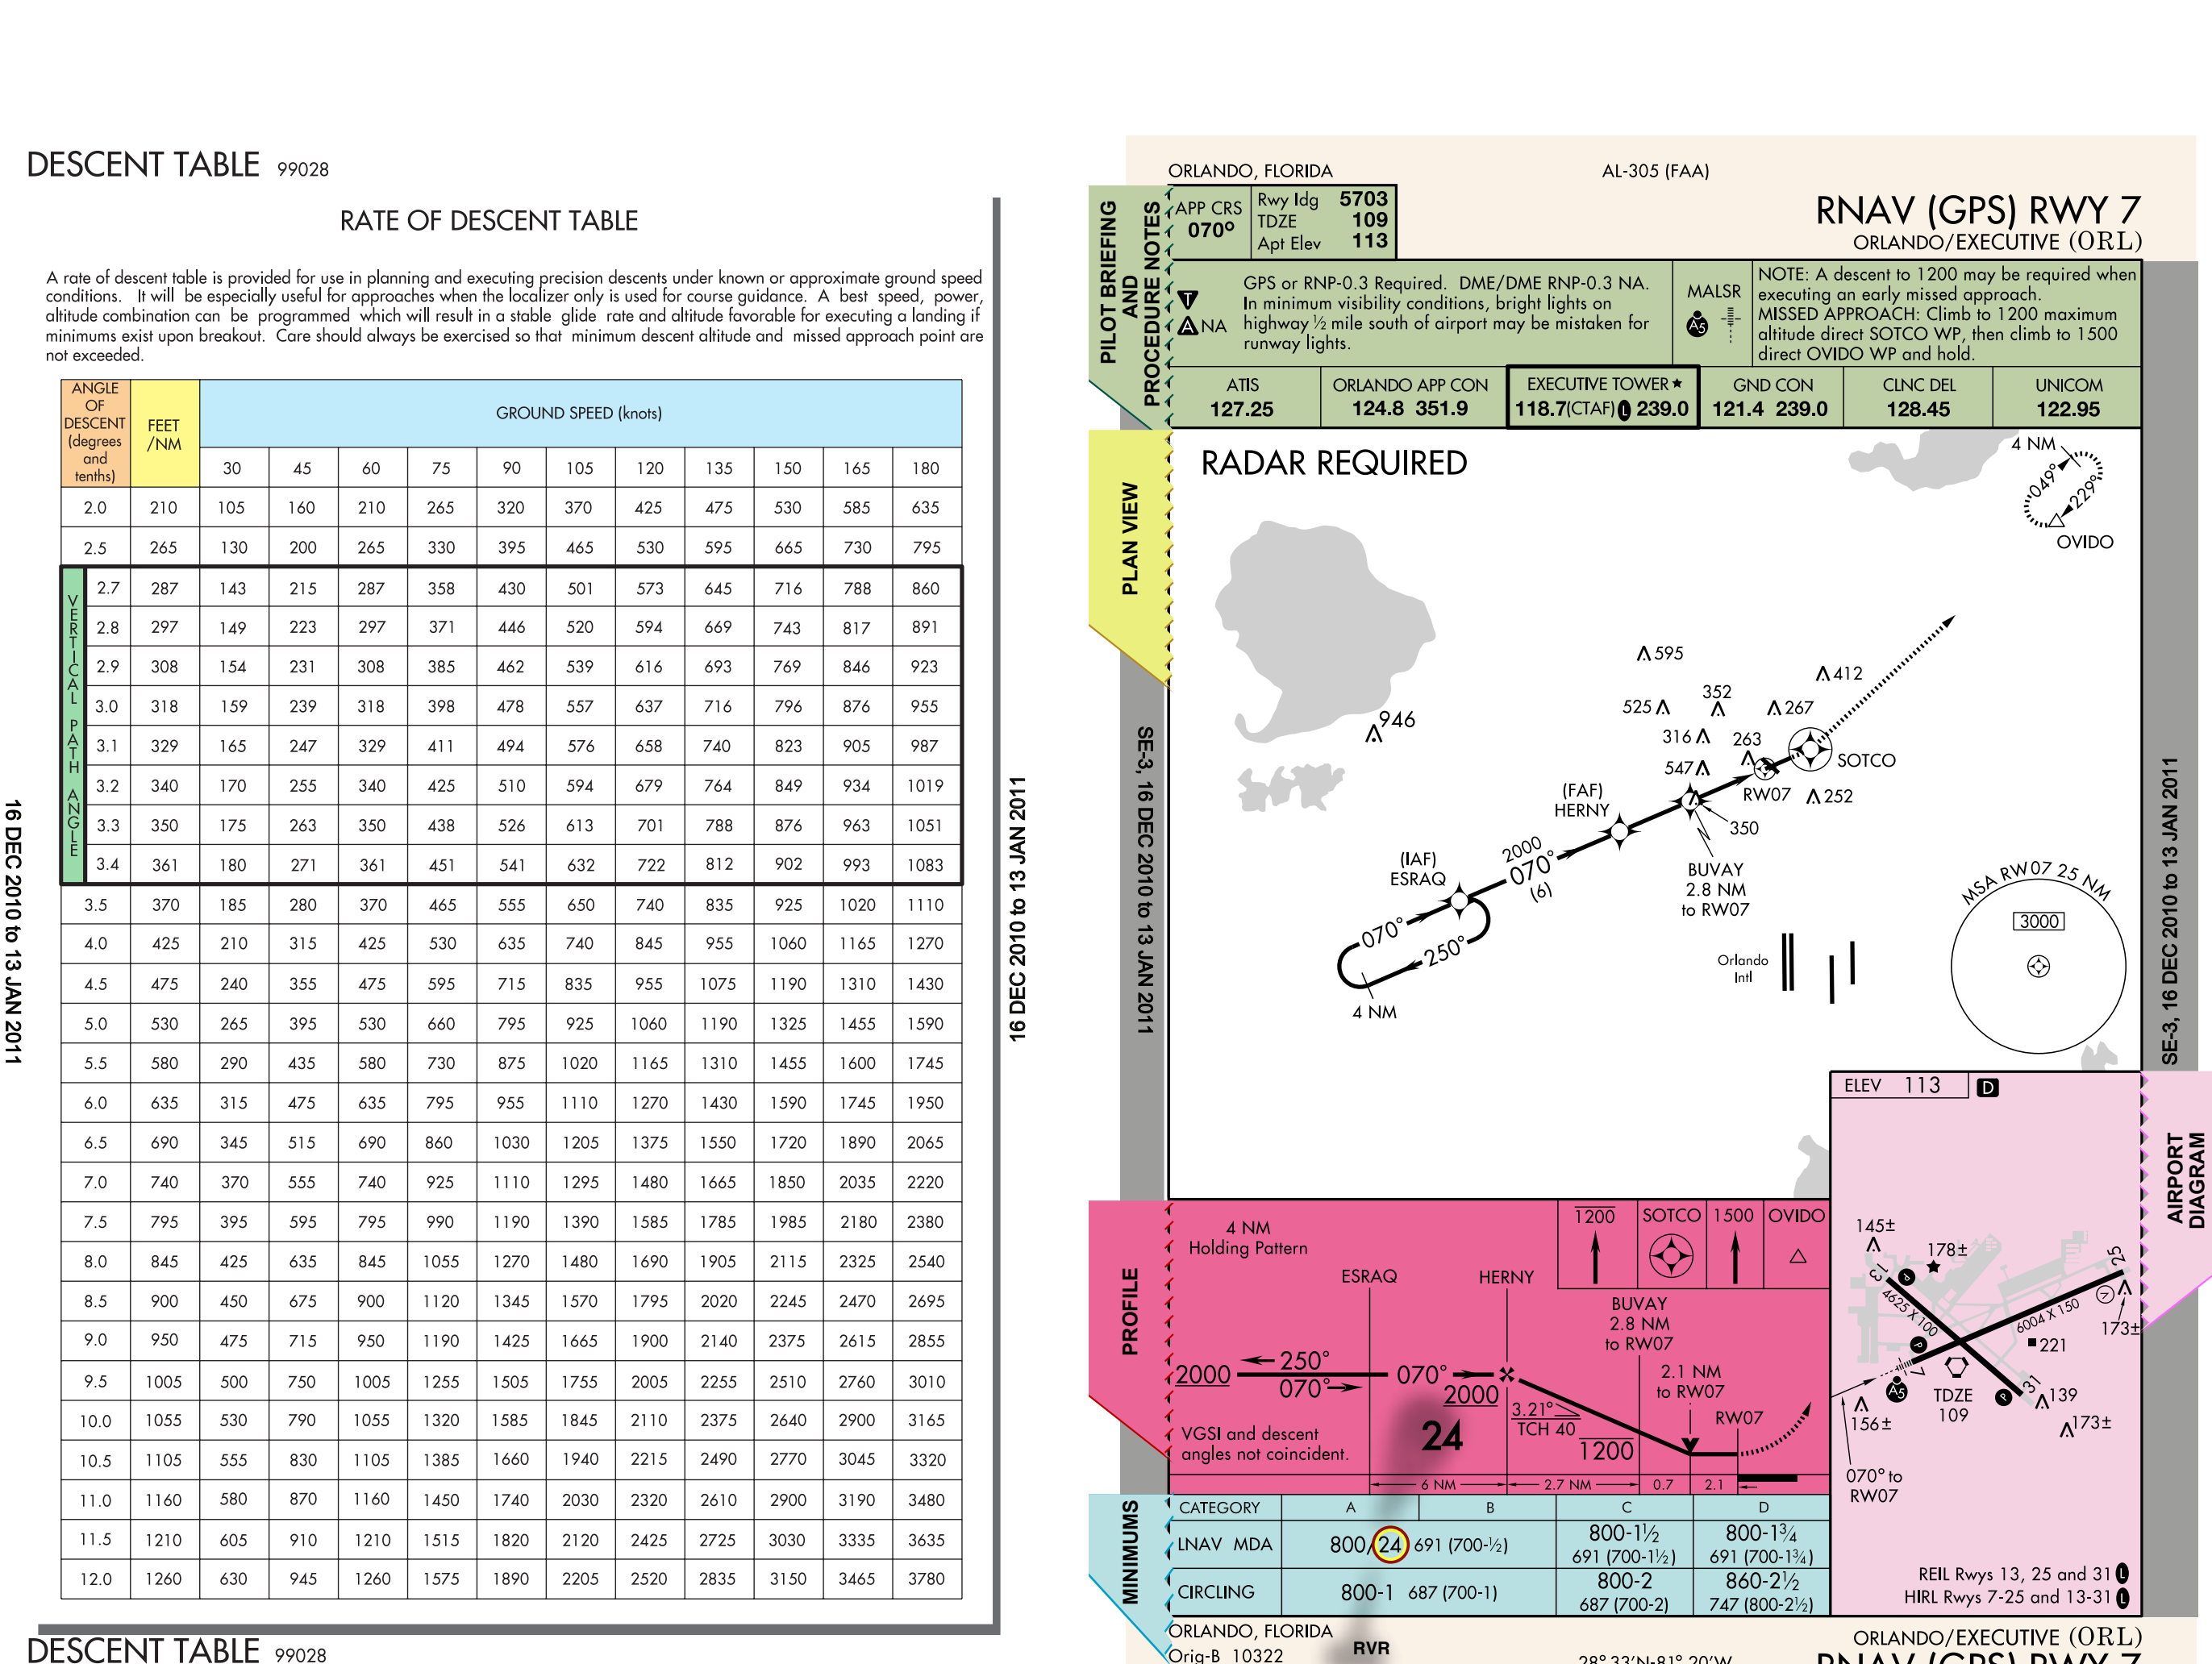
The Vertical Descent Angle (VDA) found on nonprecision approach charts provides the pilot with information required to establish a stabilized approach descent from the FAF or stepdown fix to the TCH. [Figure 1-17] Pilots can use the published angle and estimated or actual groundspeed to find a target rate of descent using the rate of descent table in the back of the TPP.
Landing Minimums
The minimums section sets forth the lowest altitude and visibility requirements for the approach, whether precision or nonprecision, straight-in or circling, or radar vectored. When a fix is incorporated in a nonprecision final segment, two sets of minimums may be published depending upon how the fix can be identified. Two sets of minimums may also be published when a second altimeter source is used in the procedure. The minimums ensure that final approach obstacle clearance is provided from the start of the final segment to the runway or MAP, whichever occurs last. The same minimums apply to both day and night operations unless different minimums are specified in the notes section of the pilot briefing. Published circling minimums provide obstacle clearance when pilots remain within the appropriate area of protection. [Figure 1-18]
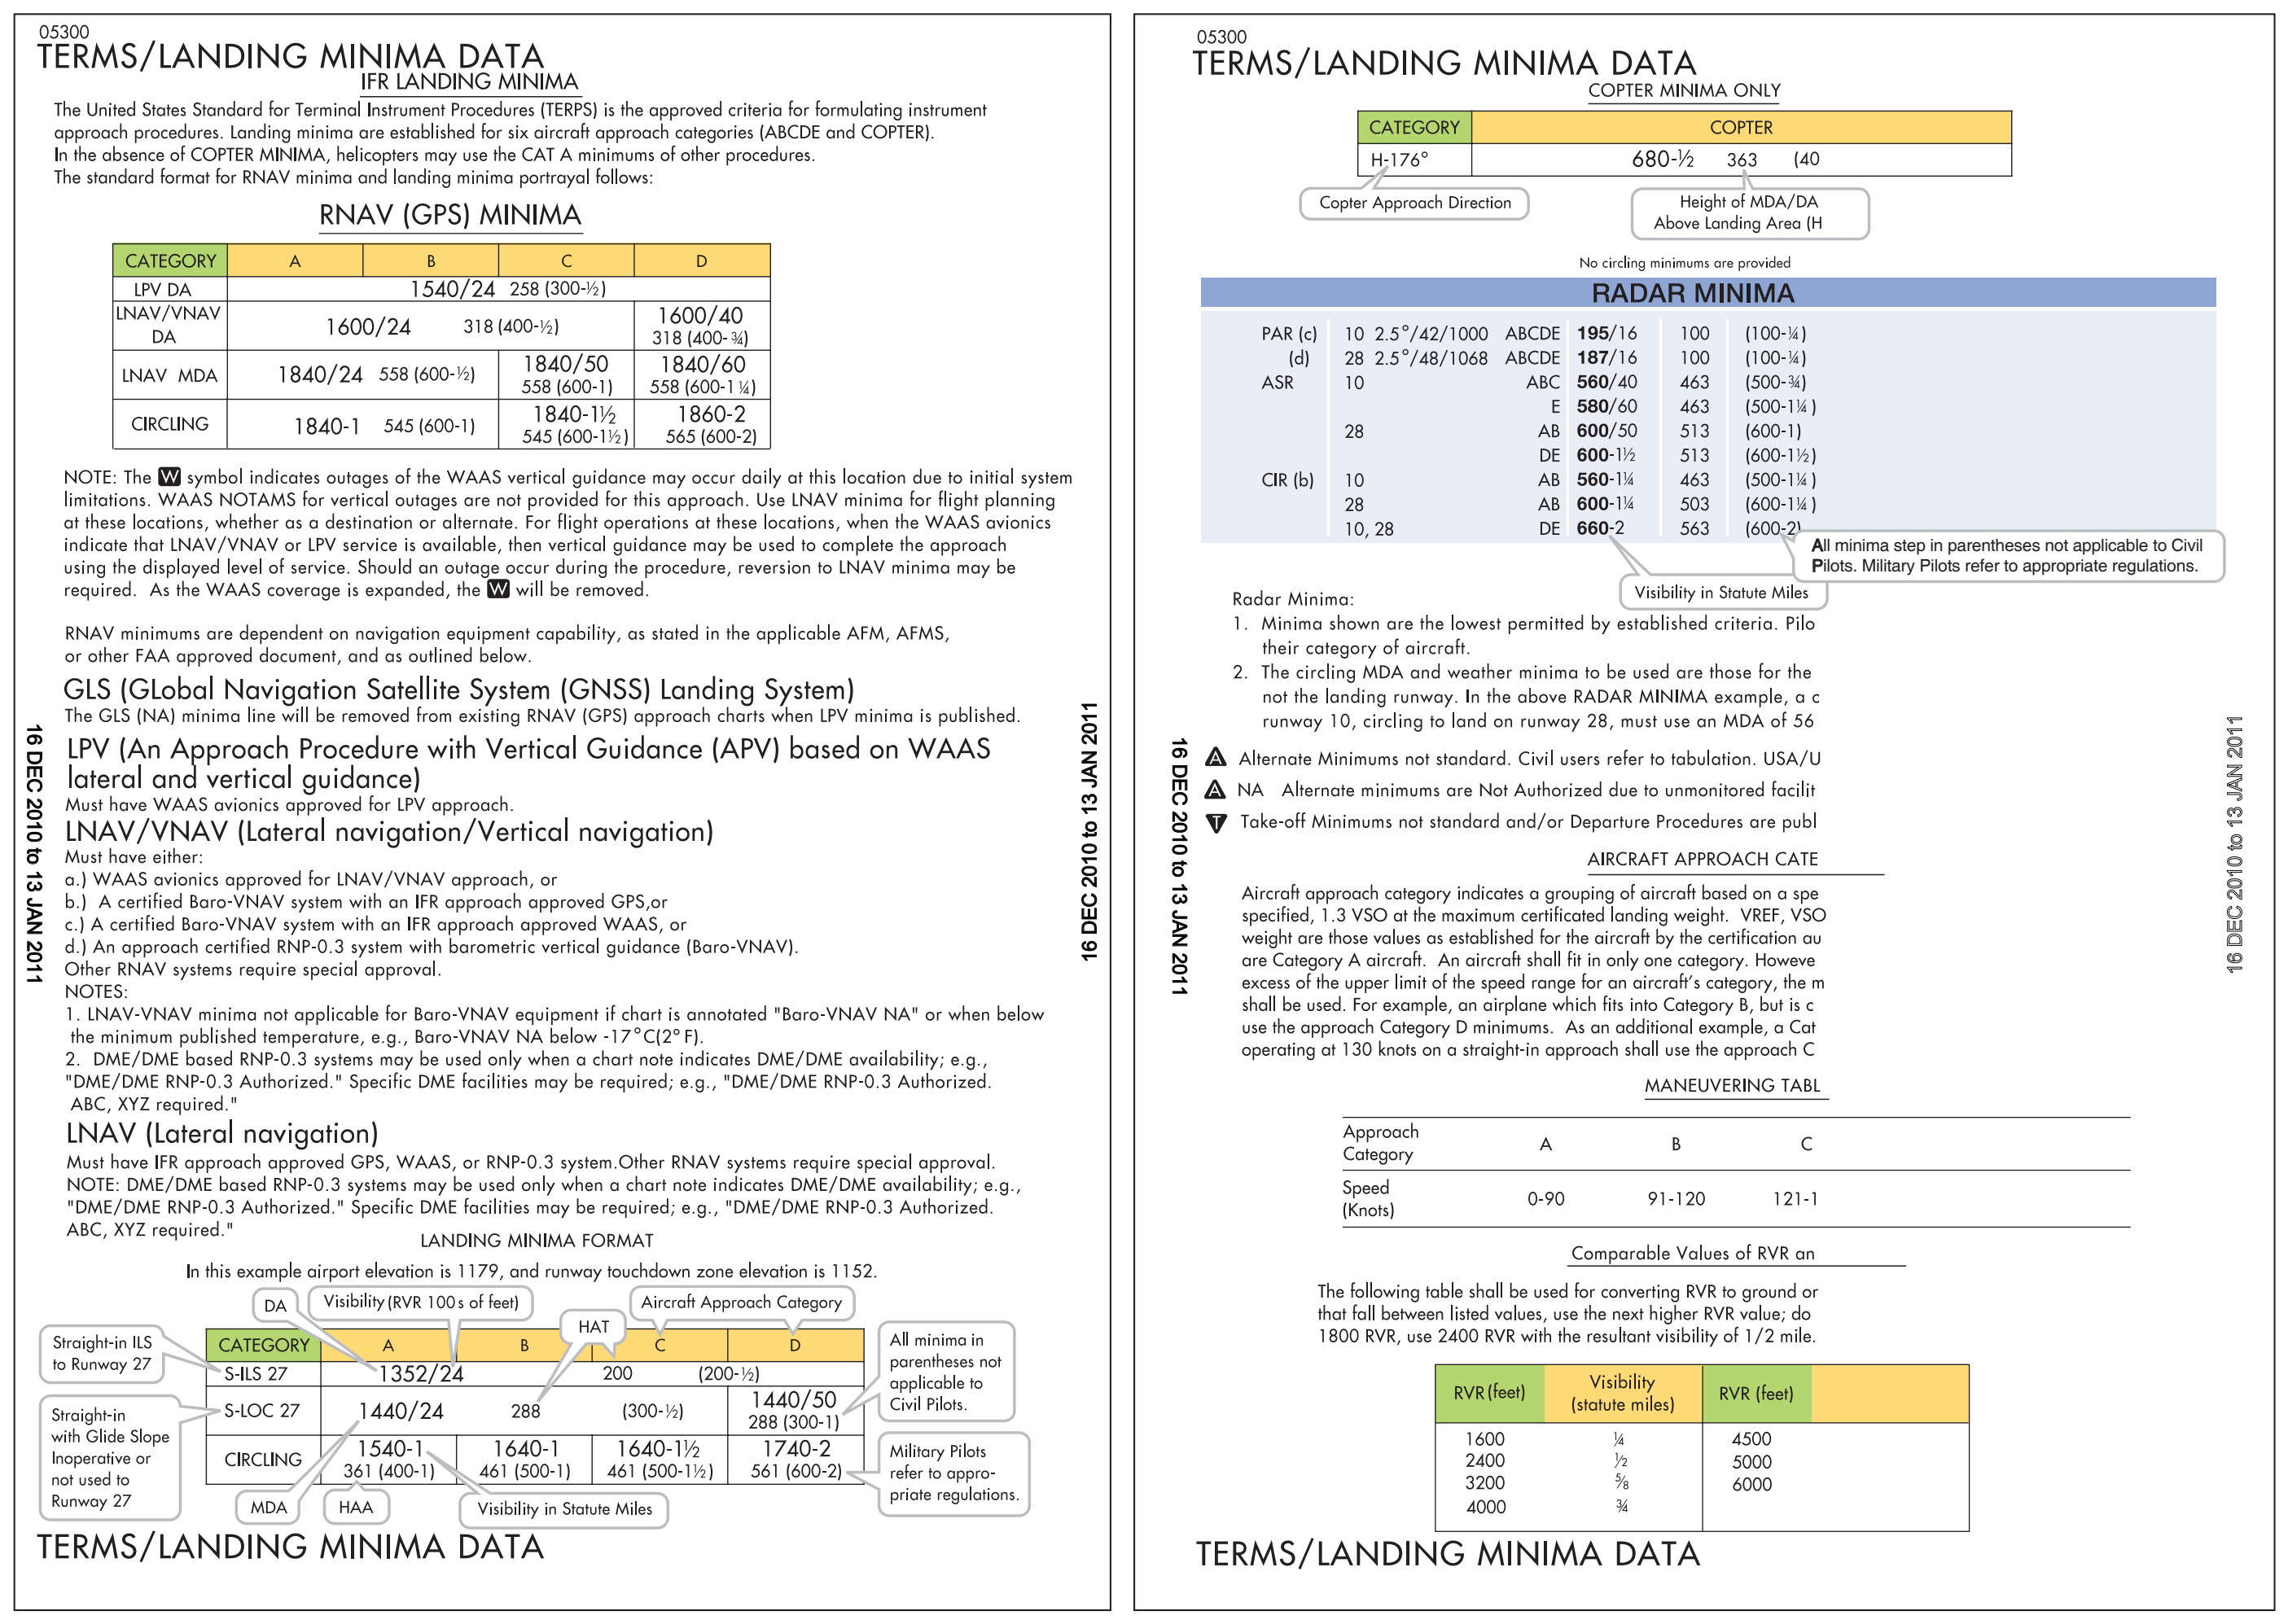
Minimums are specified for various aircraft approach categories based upon a value 1.3 times the stalling speed of the aircraft in the landing configuration at maximum certified gross landing weight. If it is necessary to maneuver at speeds in excess of the upper limit of a speed range for a category, the minimums for the next higher category should be used. For example, an aircraft that falls into category A, but is circling to land at a speed in excess of 91 knots, should use approach category B minimums when circling to land. [Figure 1-19]
The minimums for straight-in and circling appear directly under each aircraft category. [Figure 1-19] When there is no solid division line between minimums for each category on the rows for straight-in or circling, the minimums apply to the two or more categories.
The terms used to describe the minimum approach altitudes differ between precision and nonprecision approaches. Precision approaches use DH, which is referenced to the height above threshold elevation (HAT). Nonprecision approaches use MDA, referenced to “feet MSL.” The MDA is also referenced to HAT for straight-in approaches, or height above airport (HAA) for circling approaches. On AeroNav Products charts, the figures listed parenthetically are for military operations and are not used in civil aviation.
Visibility figures are provided in statute miles or runway visual range (RVR), which is reported in hundreds of feet. RVR is measured by a transmissometer, which represents the horizontal distance measured at points along the runway. It is based on the sighting of either high intensity runway lights or on the visual contrast of other targets, whichever yields the greater visual range. RVR is horizontal visual range, not slant visual range, and is used in lieu of prevailing visibility in determining minimums for a particular runway. It is illustrated in hundreds of feet if less than a mile (i.e., “24” is an RVR of 2,400 feet). [Figures 1-19 and 1-20]
Visibility figures are depicted after the DA/DH or MDA in the minimums section. If visibility in statute miles is indicated, an altitude number, hyphen, and a whole or fractional number appear; for example, 530-1, which indicates “530 feet MSL” and 1 statute mile visibility. This is the descent minimum for the approach. The RVR value is separated from the minimum altitude with a slash, such as “1065/24,” which indicates 1,065 feet MSL and an RVR of 2,400 feet. If RVR is prescribed for the procedure, but not available, a conversion table is used to provide the equivalent visibility in this case, of ½ statute mile visibility. [Figure 1-20] The conversion table is also available in the TPP.
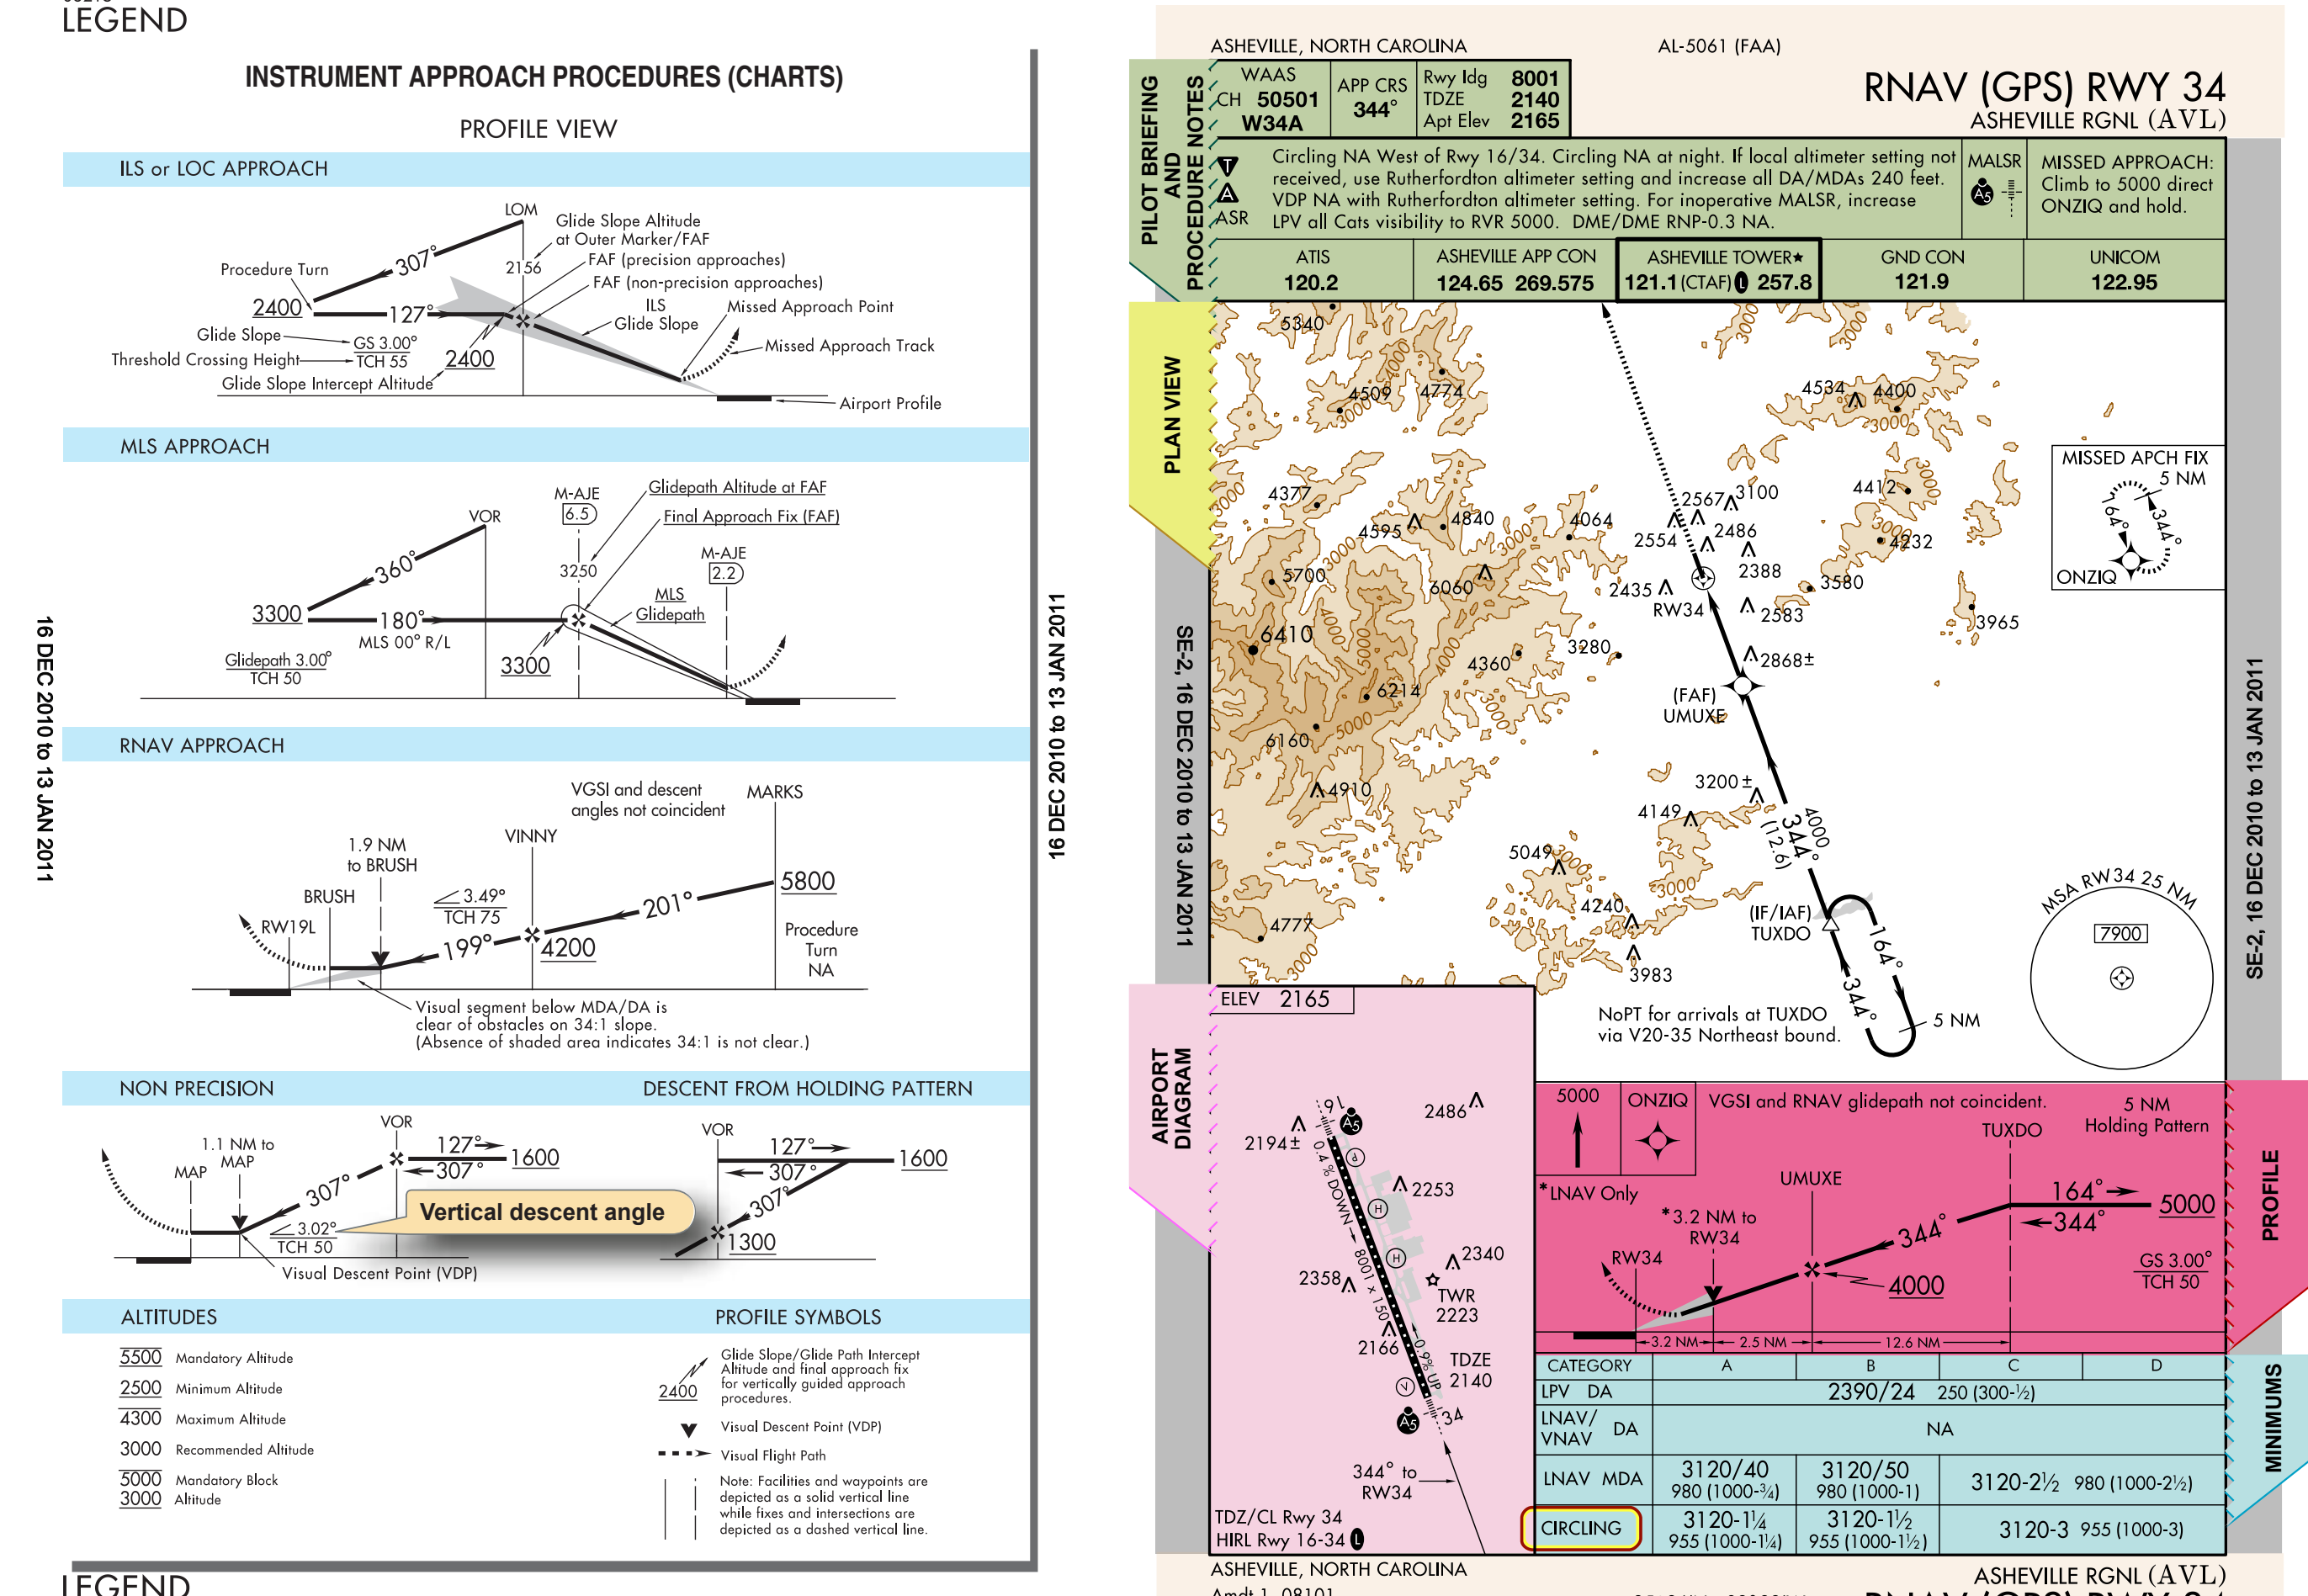
When an alternate airport is required, standard IFR alternate minimums apply. For aircraft other than helicopters, precision approach procedures require a 600-feet ceiling and 2 statute miles visibility; nonprecision approaches require an 800-feet ceiling and 2 statute miles visibility. Helicopter alternate minimums are a ceiling that is 200 feet above the minimum for the approach to be flown and visibility of at least 1 statute mile, but not less than the minimum visibility for the approach to be flown. When a black triangle with a white “A” appears in the notes section of the pilot briefing, it indicates non-standard IFR alternate minimums exist for the airport. If an “NA” appears after the “A” [black downward-pointing triangle with a white “A”, followed by “NA”], then alternate minimums are not authorized. This information is found in the beginning of the TPP.
In addition to the COPTER approaches, instrument-equipped helicopters may fly standard approach procedures. The required visibility minimum may be reduced to one-half the published visibility minimum for category A aircraft, but in no case may it be reduced to less than ¼ mile or 1,200 feet RVR.
Two terms are specific to helicopters. Height above landing (HAL) means height above a designated helicopter landing area used for helicopter IAPs. “Point in space approach” refers to a helicopter IAP to a MAP more than 2,600 feet from an associated helicopter landing area.
Airport Sketch /Airport Diagram
Prior to all flights, pilots should take the time and study the airport layout for all of the airports that they intend to land, including those that may be used as an alternate. During the flight planning phase, study the taxi procedures for the departure airport and landing procedures for the arrival airport. The expected taxi route should be checked against the airport diagram or taxi chart, and special attention should be given to the unique or complex intersections along the taxi route. Pilots should identify critical times and locations on the taxi route (e.g., transitioning through complex intersections, crossing intervening runways, entering and lining up on the runway for takeoff, and approaching and lining up on the runway for landing).
By knowing the layout of the airport and their particular procedures, pilots are able to anticipate, understand, and safely execute all ATC directives and procedures. A major contributor to runway incursions is pilots not knowing the airport layout and procedures. This lack of situational awareness causes unnecessary accidents that can be avoided by proper flight planning. The FAA believes that following the aircraft’s progress on the airport diagram to be sure that the instructions received from ATC are being followed is one of the key procedures in reducing runway incursions. To do this, pilots must take the time prior to the flight to study all procedures so that they are not trying to learn about the airport while they are receiving ATC instructions.
The airport sketch, located on the bottom of the chart, includes many helpful features. IAPs for some of the larger airports devote an entire page to an airport diagram. Airport sketch information concerning runway orientation, lighting, final approach bearings, airport beacon, and obstacles all serve to guide the pilot in the final phases of flight. See Figure 1-21 for a legend of airport diagram/airport sketch features (see also Figure 1-10 for an example of an airport diagram).