Chapter 17
Tropical Weather
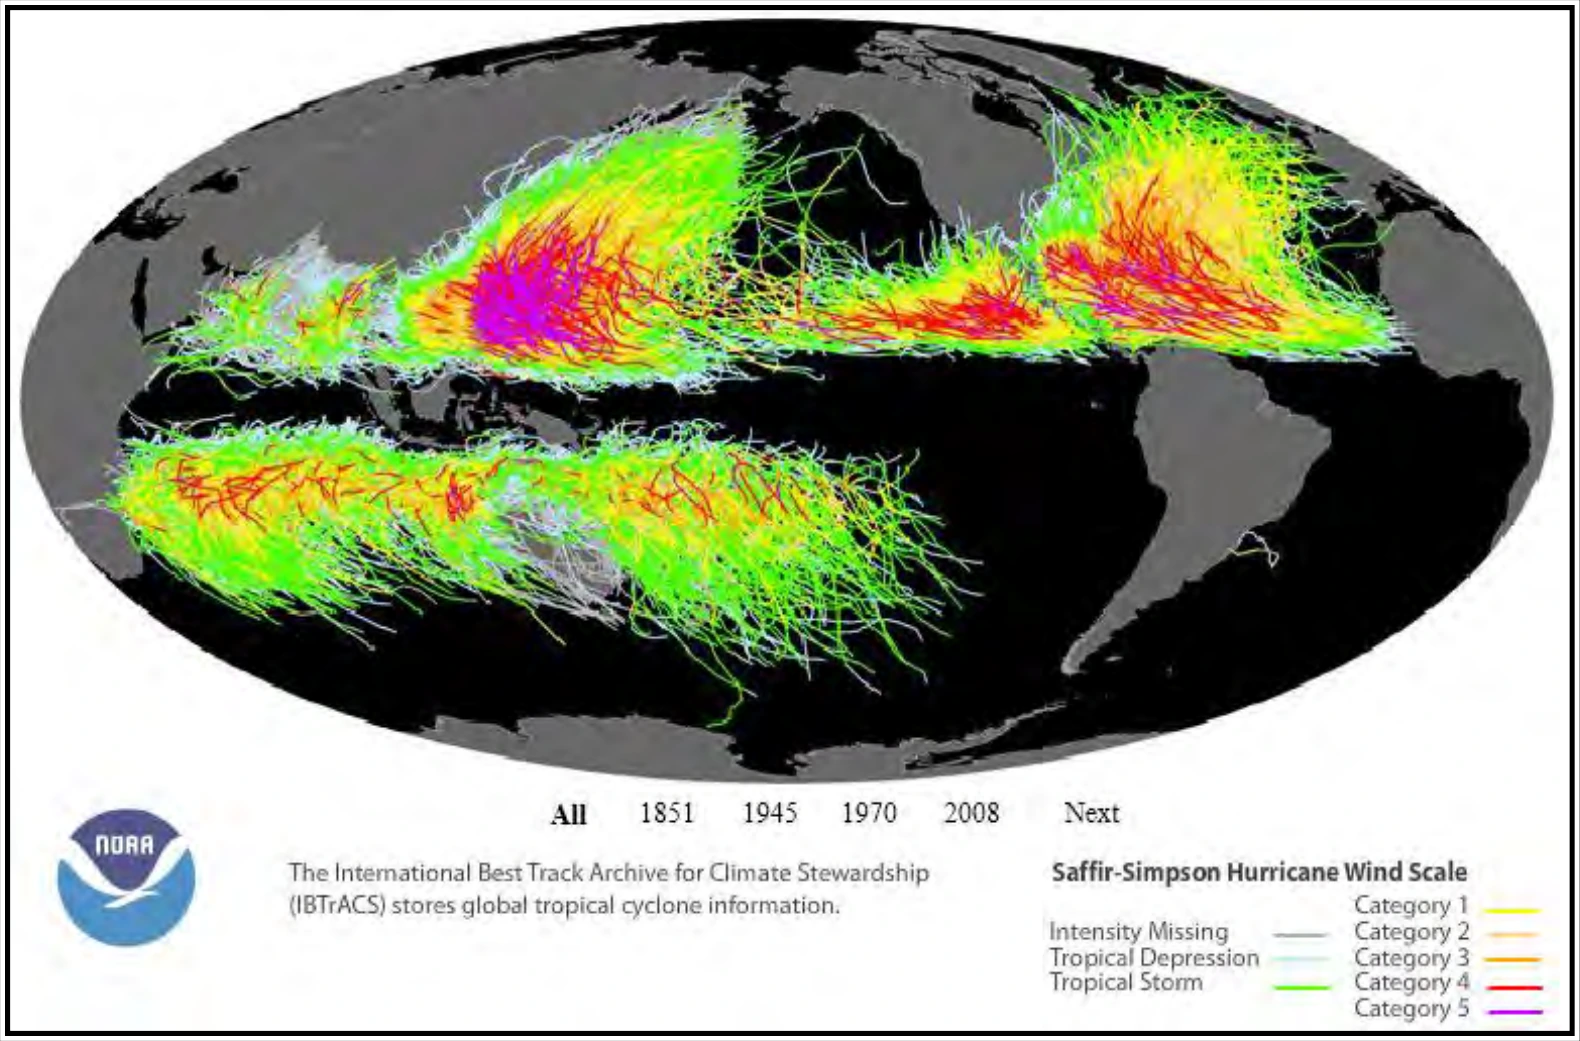
This map is based on all storm tracks available from the International Best Track Archive for Climate Stewardship (IBTrACS), a global inventory of tropical cyclones, through 2008. The accumulation of tracks reveals several details of hurricane climatology, such as where the most severe storms form and the large-scale atmospheric patterns that influence the track of hurricanes. (Note: See Table 17-1 for wind strength associated with each scale on the Saffir-Simpson Hurricane Wind Scale.)
17.3.5.2 Movement
Tropical cyclones in the Northern Hemisphere usually move in a direction between west and northwest while in low latitudes. As these storms move toward the mid-latitudes, they come under the influence of the prevailing westerlies. At this time, the storms are under the influence of two wind systems: the trade winds at low levels and prevailing westerlies aloft. Thus, a storm may move very erratically, and may even reverse course or circle. Finally, the prevailing westerlies gain control, and the storm recurves toward the north, then to the northeast, and finally to the east-northeast. By this time, the storm is well into mid-latitudes.
17.3.5.3 Decay
As the storm curves toward the north or east (Northern Hemisphere), it usually begins to lose its tropical characteristics and acquires characteristics of lows in middle latitudes. Cooler air flowing into the storm gradually weakens it. If the storm tracks along a coastline or over the open sea, it gives up slowly, carrying its fury to areas far removed from the Tropics. However, if the storm moves well inland, it loses its moisture source and weakens from starvation and increased surface friction, usually after leaving a trail of destruction and flooding.
When a storm takes on middle latitude characteristics, it is said to be extratropical, meaning “outside the Tropics.” Tropical cyclones produce weather conditions that differ somewhat from those produced by their higher latitude cousins and invite investigation.
17.3.5.4 Weather in a Tropical Depression
While in its initial developing stage, the cyclone is characterized by a circular area of broken-to-overcast clouds in multiple layers. Embedded in these clouds are numerous showers and thunderstorms. Rain shower and thunderstorm coverage varies from scattered to almost solid. The diameter of the cloud pattern varies from less than 100 mi in small systems to well over 200 mi in large ones.
17.3.5.5 Weather in Tropical Storms and Hurricanes
As cyclonic flow increases, the thunderstorms and rain showers form into broken or solid lines, paralleling the wind flow that is spiraling into the center of the storm. These lines are the spiral rain bands frequently seen on radar. These rain bands continually change as they rotate around the storm. Rainfall in the rain bands is very heavy, reducing ceiling and visibility to near zero. Winds are usually very strong and gusty and, consequently, generate violent turbulence. Between the rain bands, ceilings and visibilities are somewhat better, and turbulence generally is less intense.
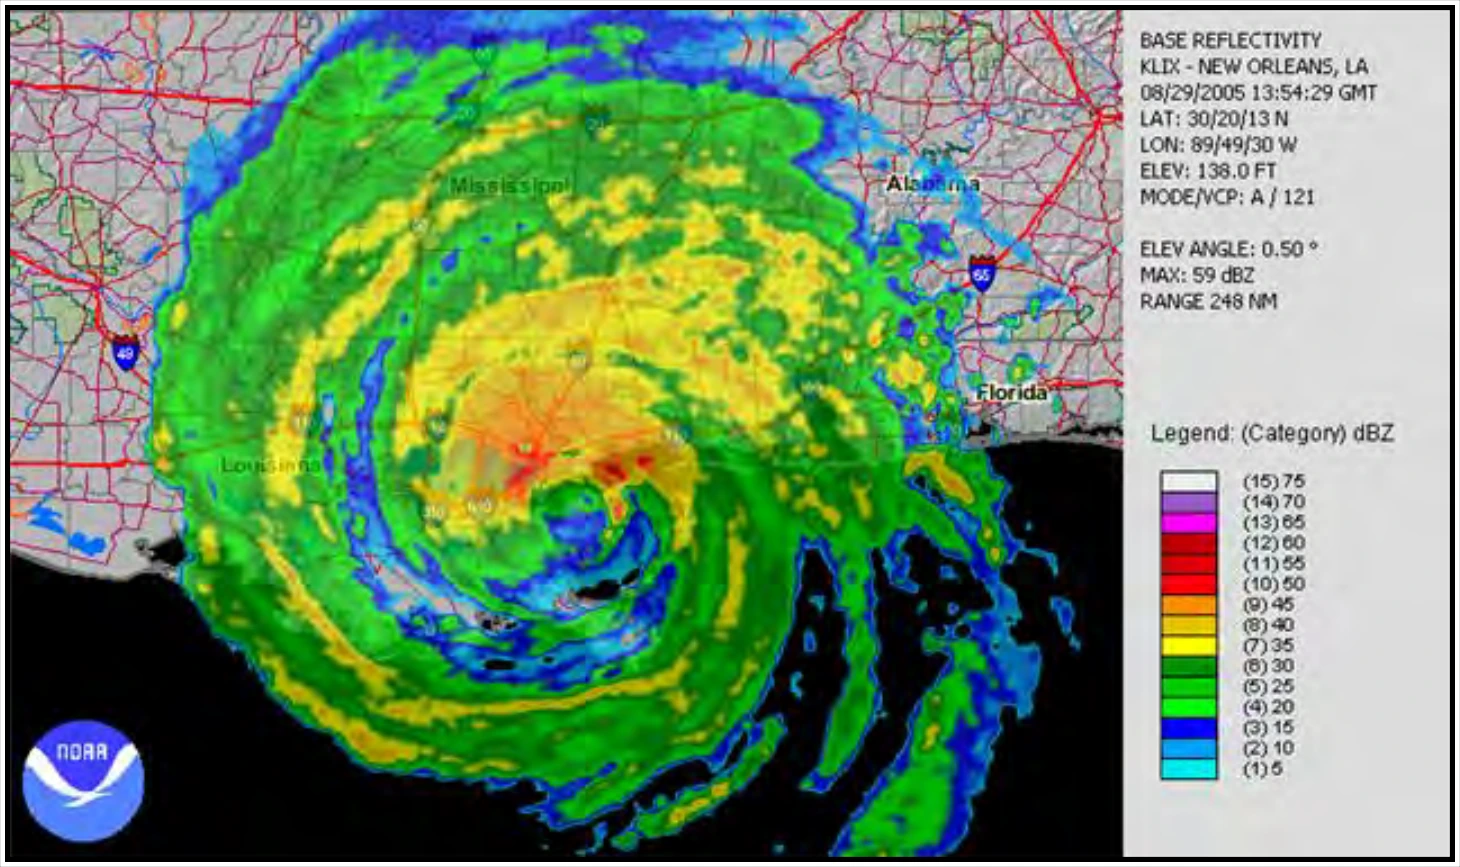
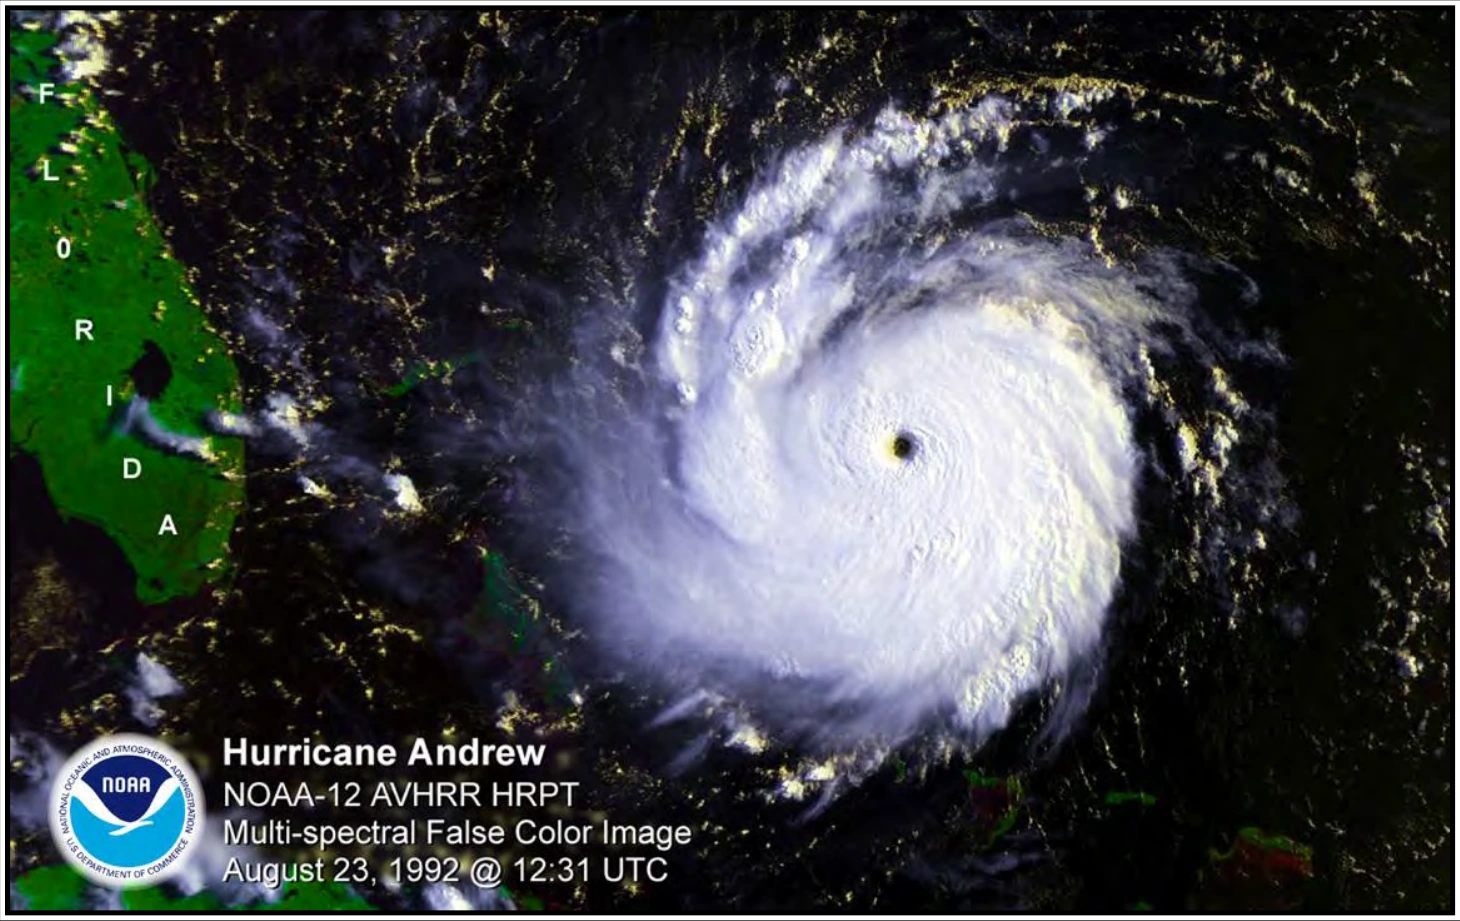
Most tropical cyclones that form eyes do so within 48 hours of the cyclone reaching tropical storm strength. In the eye, skies are free of turbulent cloudiness, and wind is comparatively light. The average diameter of the eye is between 15 mi and 20 mi but sometimes is as small as 7 mi and rarely is more than 30 mi in diameter. Surrounding the eye is a wall of clouds that may extend above 50,000 ft. This wall of clouds contains deluging rain and the strongest winds of the storm. Maximum wind speeds of 175 kt have been recorded in some storms. See Figure 17-8 and Figure 17-9, which contain a radar display and satellite photograph of a mature hurricane, respectively. Note the spiral rain bands and the circular eye. Notice the similarity between these two figures.
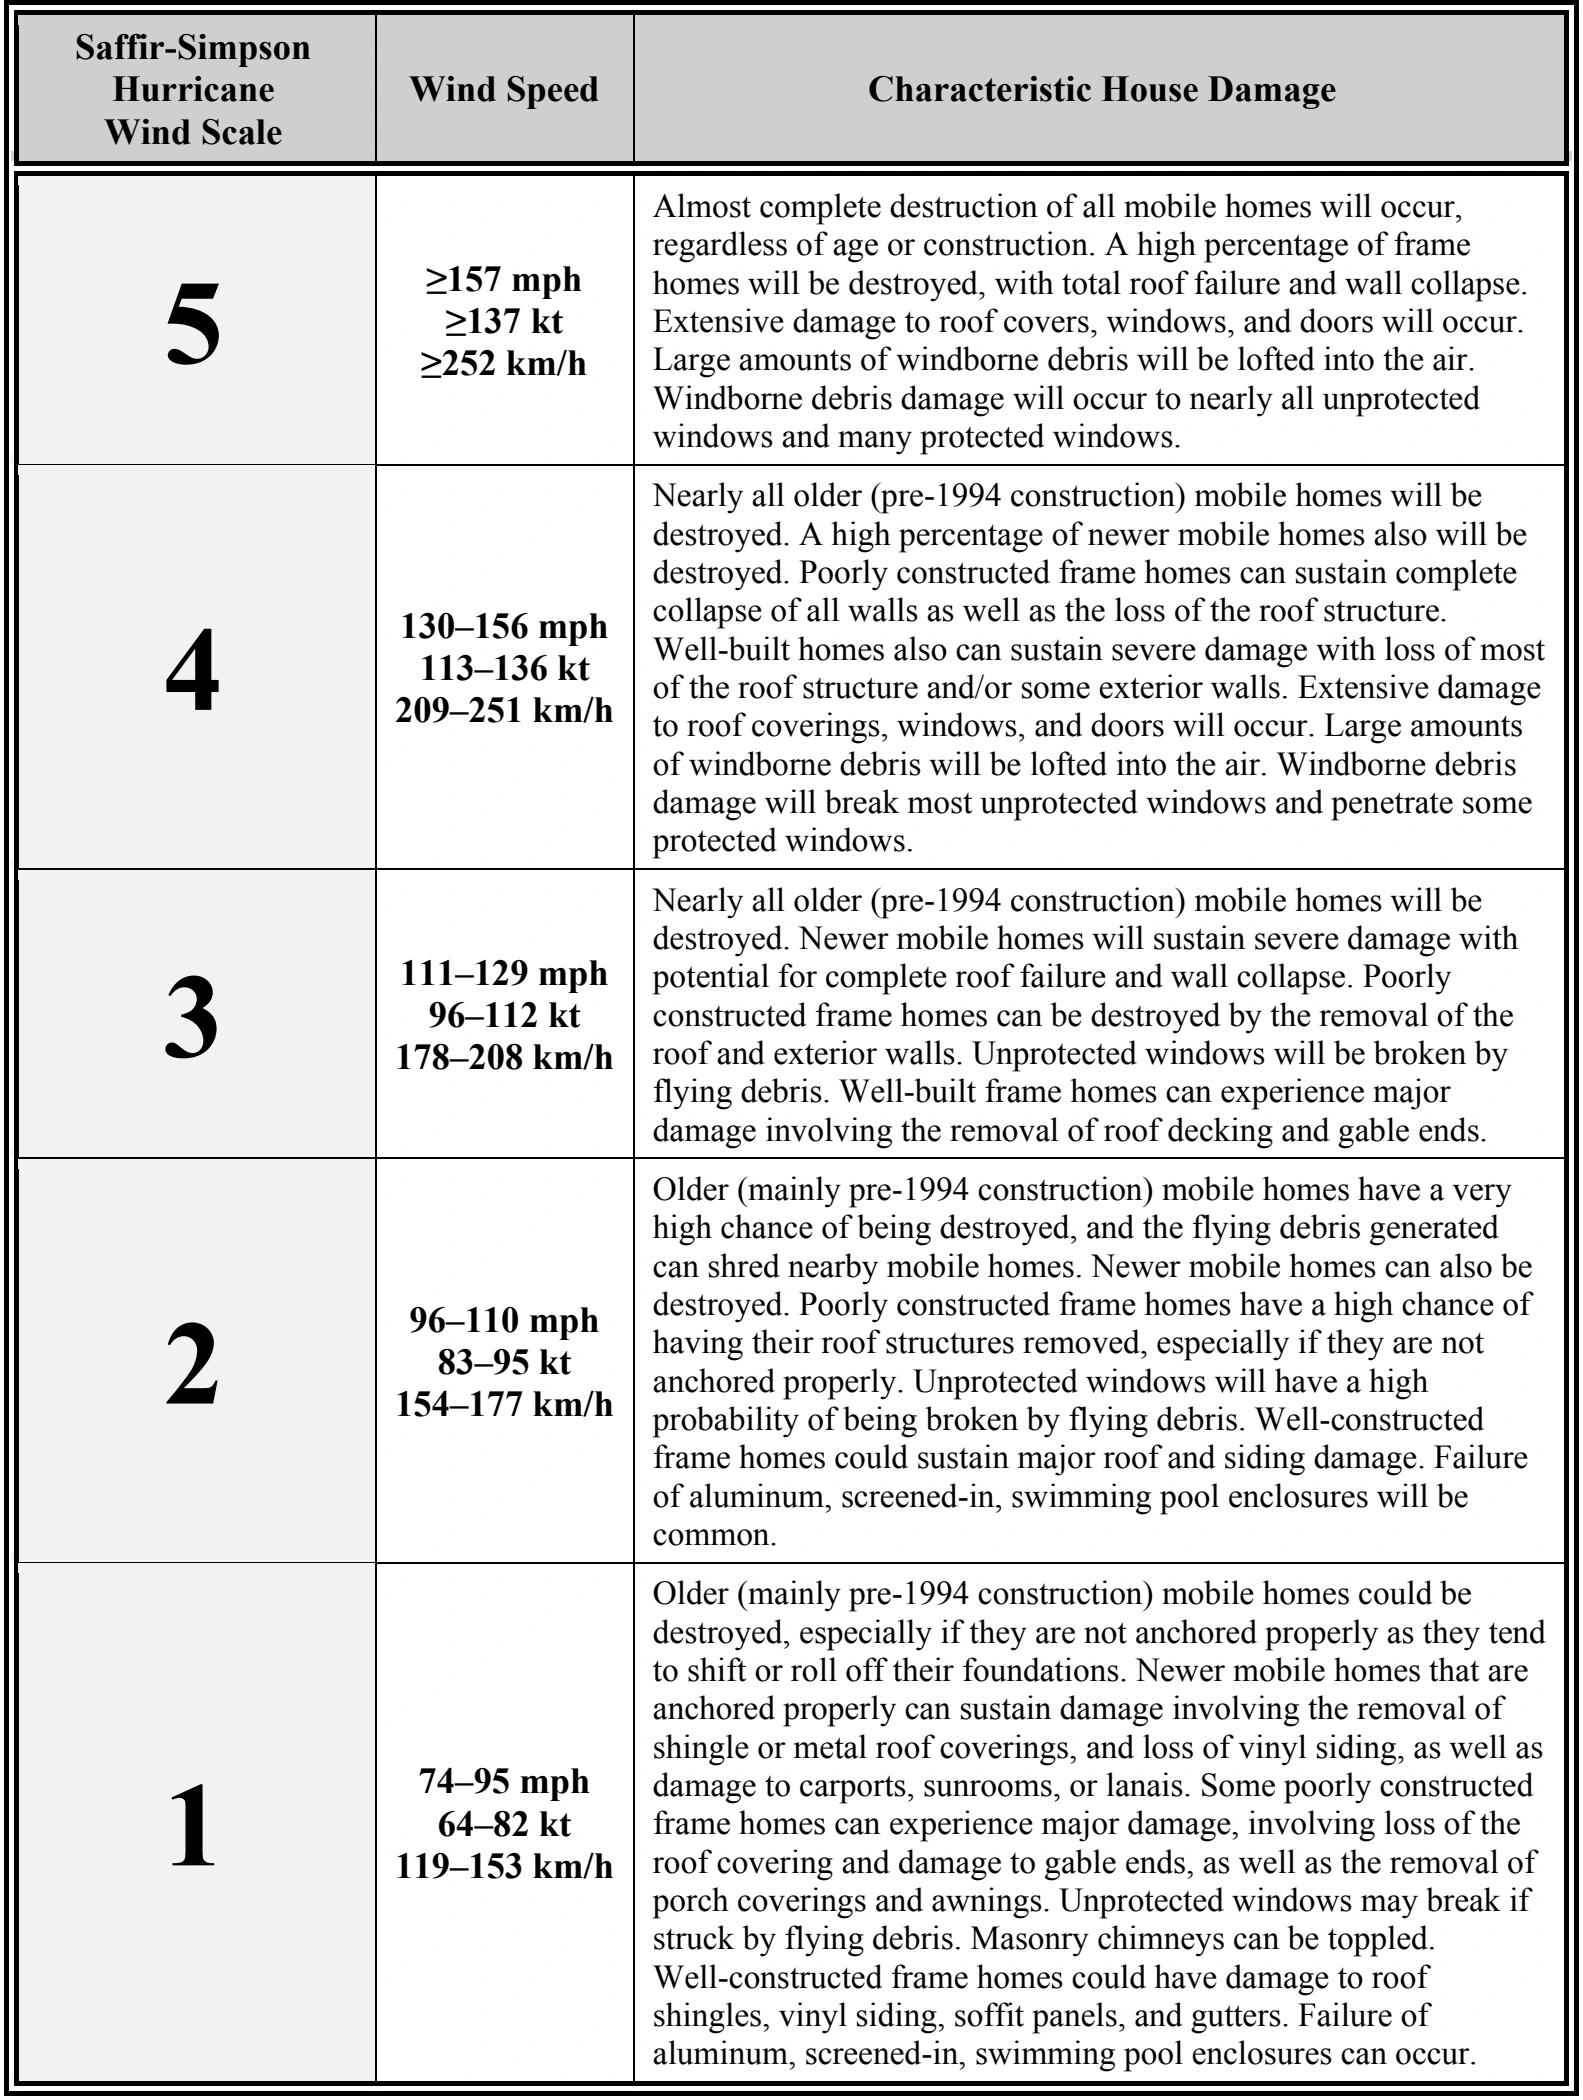
Table 17-1 identifies the wind speed and characteristic house damage for each level on the Saffir-Simpson Hurricane Wind Scale.