
Chapter 2
En Route Operations
- Laterally—5 miles
- Vertically—
- 1,000 feet (if the aircraft is below FL 290, or between FL 290 and FL 410 for RVSM compliant aircraft)
- 2,000 feet (if the aircraft is at FL 290 or above)
The controllers can accomplish this separation by issuing instructions to the pilots of the aircraft involved. Altitude assignments, speed adjustments, and radar vectors are examples of instructions that might be issued to aircraft.
En route control is handled by pinpointing aircraft positions through the use of flight progress strips. These strips are pieces of printed paper containing pertinent information extracted from the pilot’s flight plan. These strips are printed 20 minutes prior to an aircraft reaching each Center’s sector. A flight progress strip tells the controller everything needed to direct that aircraft. If the flight progress strips of each aircraft approaching a sector are arranged properly, it is possible to determine potential conflicts long before the aircraft are even visible on the Center controller’s display. In areas where radar coverage is not available, this is the sole means of separating aircraft.
The strips, one for each en route point from which the pilot reports his or her position, are posted on a slotted board in front of the air traffic controller. [Figure 2-7] At a glance, he or she is able to see certain vital data: the type of aircraft and who is flying it (airline, business, private, or military pilot), aircraft registration number or flight number, route, speed, altitude, airway designation, and the estimated time of arrival (ETA) at destination. As the pilot calls in the aircraft’s position and time at a predetermined location, the strips are removed from their slots and filed. Any change from the original flight plan is noted on the strips as the flight continues. Thus, from a quick study of the flight progress board, a controller can assess the overall traffic situation and can avoid possible conflicts.
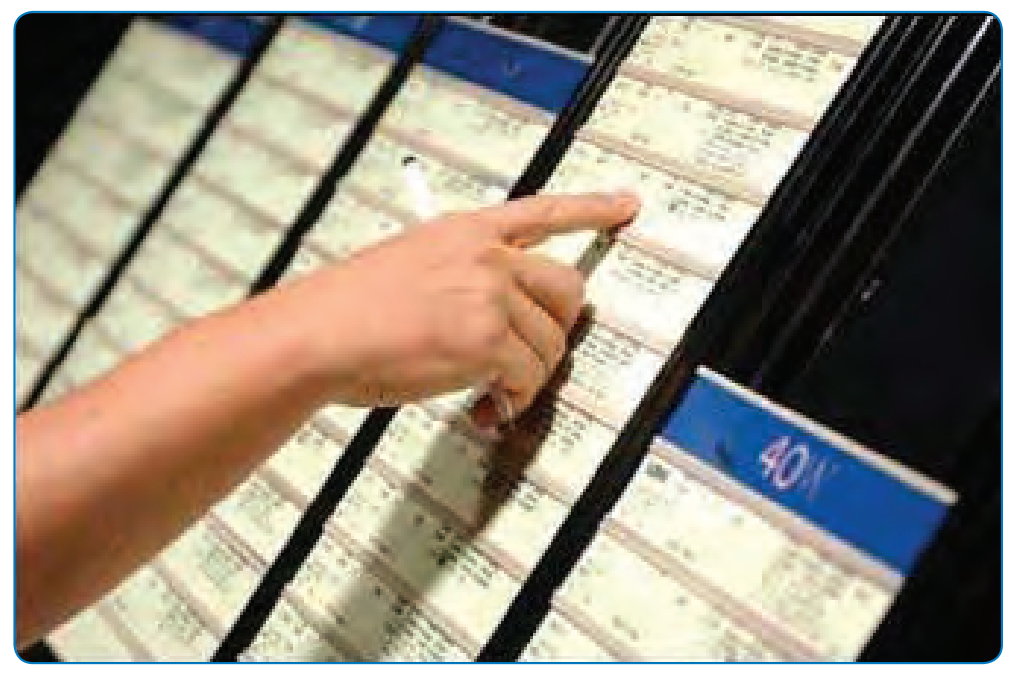
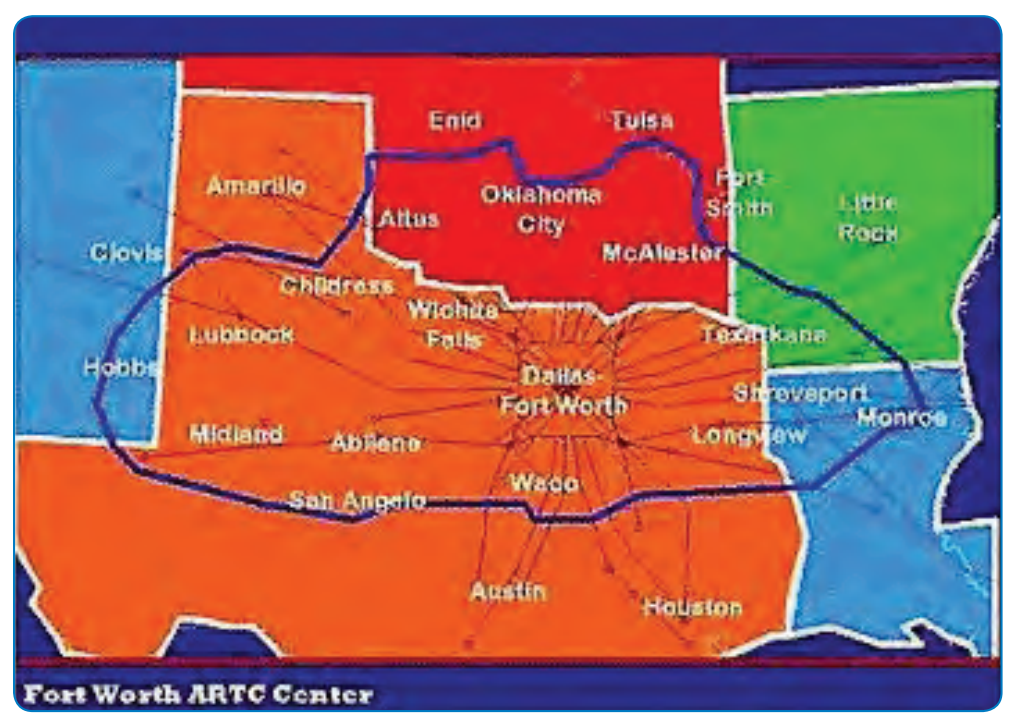
Figure 2-8 shows the Fort Worth, Texas Air Route Traffic Control Center (ZFW) and the geographical area that it covers. The Center has approximately 350 controllers. Most are certified and some are in on-the-job training.
Sectors
The airspace controlled by a Center may be further administratively subdivided into smaller, manageable pieces of airspace called sectors. A few sectors extend from the ground up, but most areas are stratified into various levels to accommodate a wide variety of traffic. Each sector is staffed by a set of controllers and has a unique radio frequency that the controller uses to communicate with the pilots. As aircraft transition from one sector to another, they are instructed to change to the radio frequency used by the next sector. Each sector also has secure landline communications with adjacent sectors, approach controls, areas, ARTCCs, flight service centers, and military aviation control facilities.
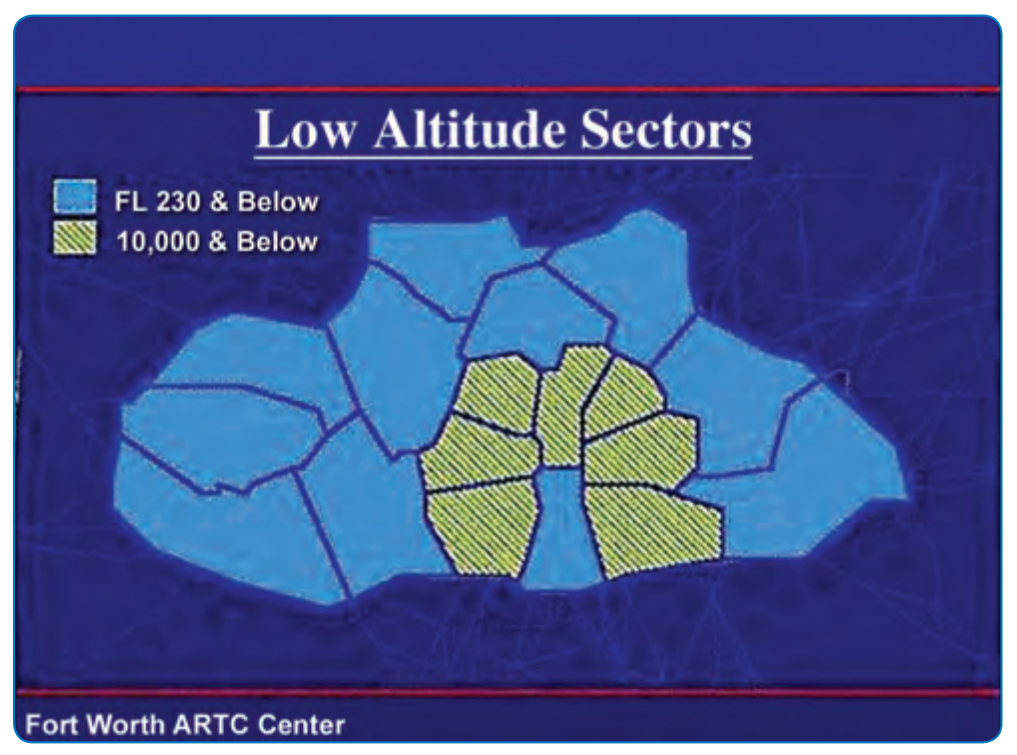
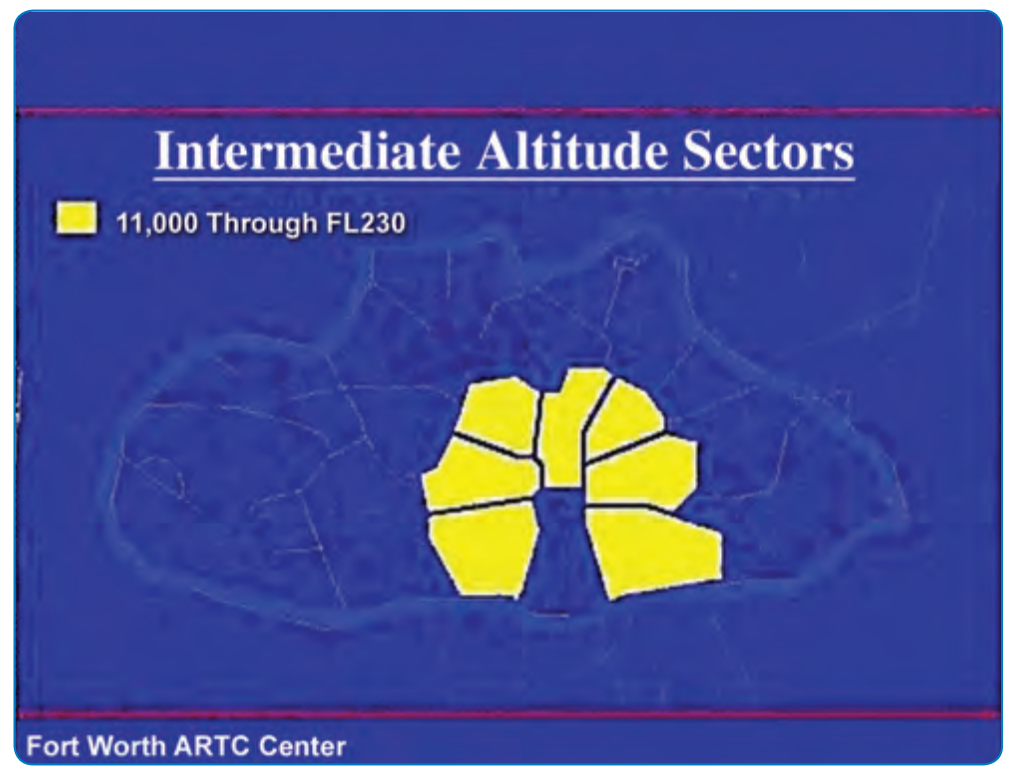
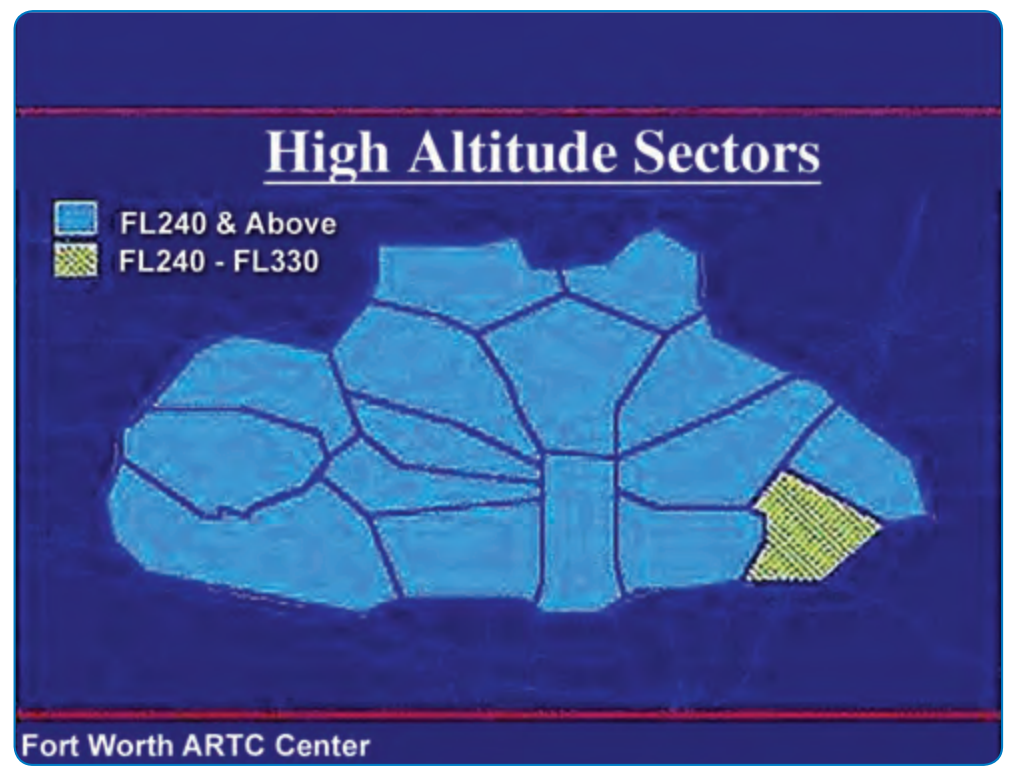
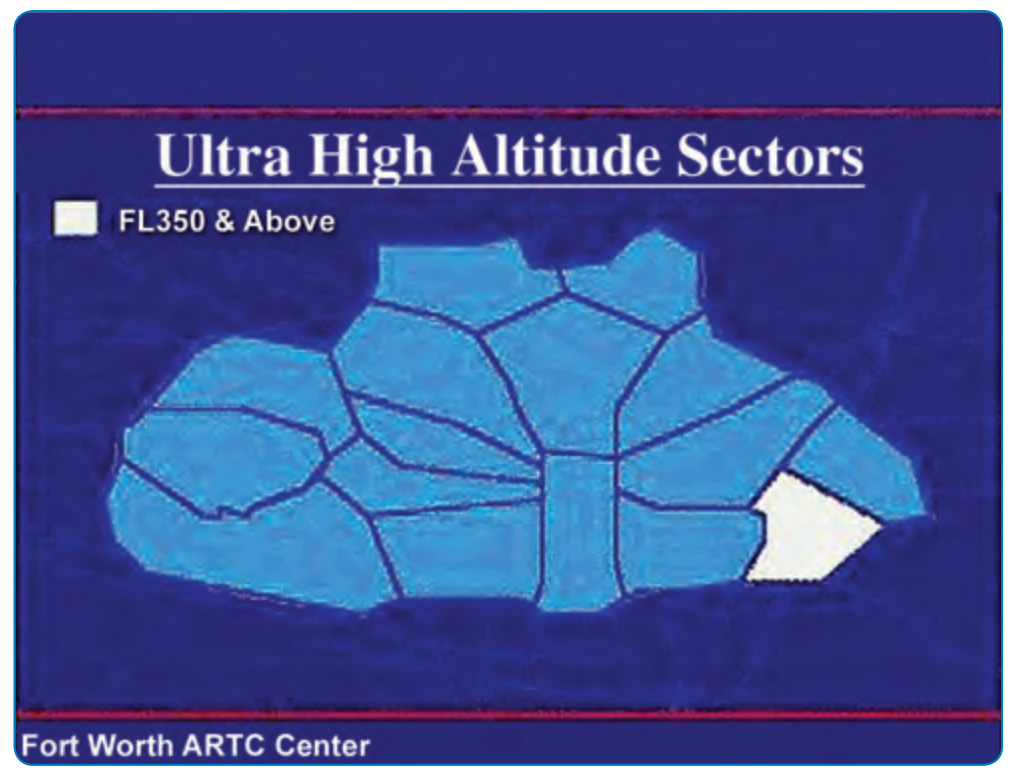
The ARTCC at Fort Worth, Texas is subdivided into sectors that are categorized as follows:
- Eighteen low altitude sectors. [Figure 2-9]
- Seven intermediate altitude sectors. [Figure 2-10]
- Sixteen high altitude sectors. [Figure 2-11]
- One ultra high altitude sector. [Figure 2-12]
From one to three controllers may work a sector, depending upon the amount of air traffic. Each controller is assigned to work the positions within an area of specialization. Controllers have direct communication with pilots, with surrounding sectors and Centers, plus the towers and Flight Service Stations (FSS) under their jurisdiction. Each control position is equipped with computer input and readout devices for aircraft flight plan data.
The Center controllers have many decision support tools (computer software programs) that provide vital information to assist the controllers in maintaining safe separation distances for all aircraft flying through their sector. For example, one tool available allows the controller to display the extended route of any aircraft on the radar screen called a vector line. This line projects where the aircraft will be within a specified number of minutes, assuming the aircraft does not change its course. This is a helpful tool to determine if aircraft flying intersecting routes pass safely within the separation standard, or if they conflict with each other. In addition to vector lines, the controller can also display a route line for any given aircraft on his or her radar screen. This tells the controller where a particular aircraft is in specified number of minutes, as well as the path the aircraft will fly to get there. Decision support tools such as these help each controller look ahead and avoid conflicts.
In-flight Requirements and Instructions
The CFRs require the pilot in command under IFR in controlled airspace to continuously monitor an appropriate Center or control frequency. When climbing after takeoff, an IFR flight is either in contact with a radar-equipped local departure control or, in some areas, an ARTCC facility. As a flight transitions to the en route phase, pilots typically expect a handoff from departure control to a Center frequency if not already in contact with the Center.