
Chapter 8
Performance
Headwinds are the most desirable as they contribute to the most increase in performance. Strong crosswinds and tailwinds may require the use of more tail rotor thrust to maintain directional control. This increased tail rotor thrust absorbs power from the engine, which means there is less power available to the main rotor for the production of lift. Some helicopters even have a critical wind azimuth or maximum safe relative wind chart. Operating the helicopter beyond these limits could cause loss of tail rotor effectiveness.
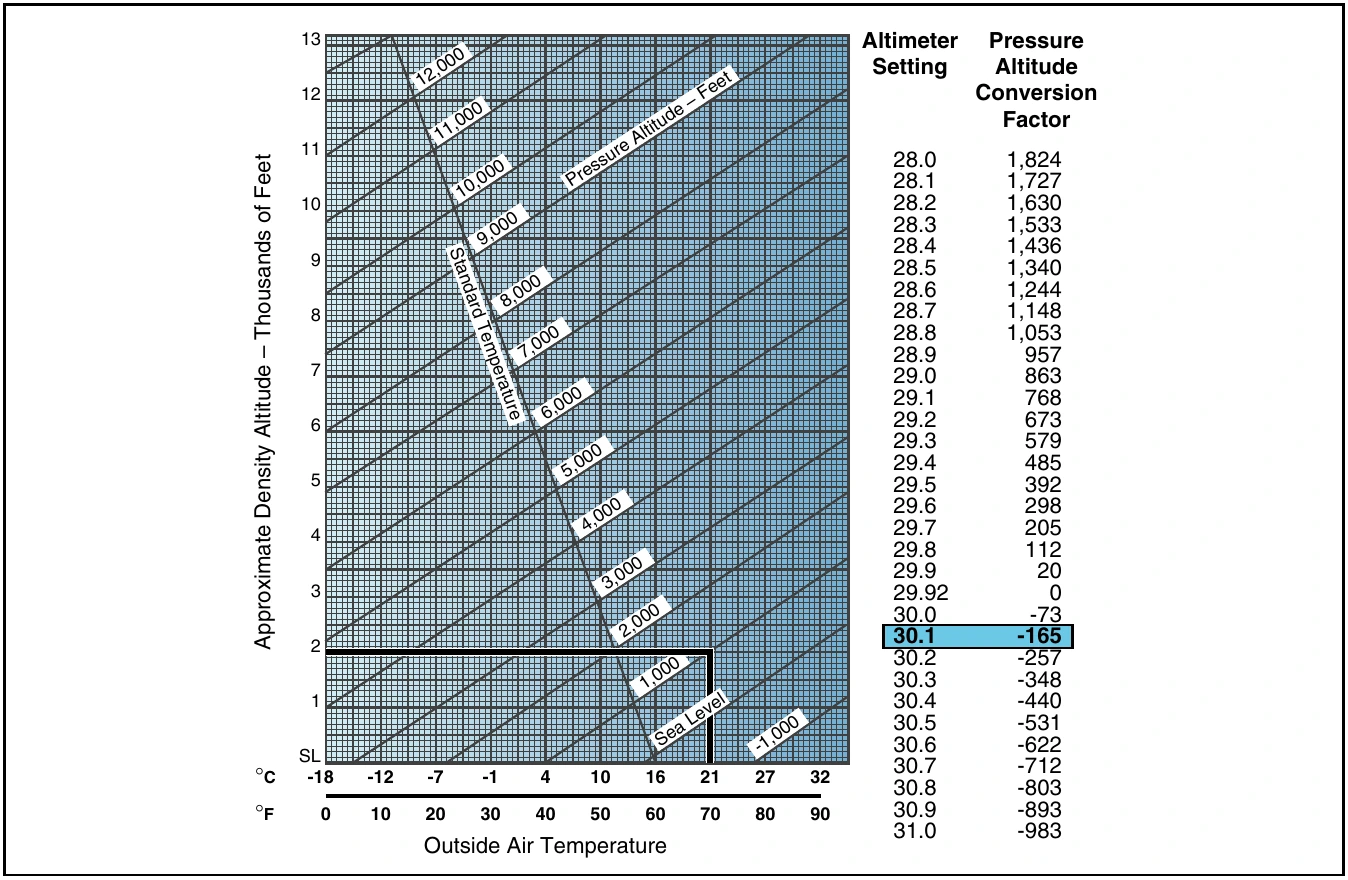
Takeoff and climb performance is greatly affected by wind. When taking off into a headwind, effective translational lift is achieved earlier, resulting in more lift and a steeper climb angle. When taking off with a tailwind, more distance is required to accelerate through translation lift.
Performance Charts
In developing performance charts, aircraft manufacturers make certain assumptions about the condition of the helicopter and the ability of the pilot. It is assumed that the helicopter is in good operating condition and the engine is developing its rated power. The pilot is assumed to be following normal operating procedures and to have average flying abilities. Average means a pilot capable of doing each of the required tasks correctly and at the appropriate times.
Using these assumptions, the manufacturer develops performance data for the helicopter based on actual flight tests. However, they do not test the helicopter under each and every condition shown on a performance chart. Instead, they evaluate specific data and mathematically derive the remaining data.
Hovering Performance
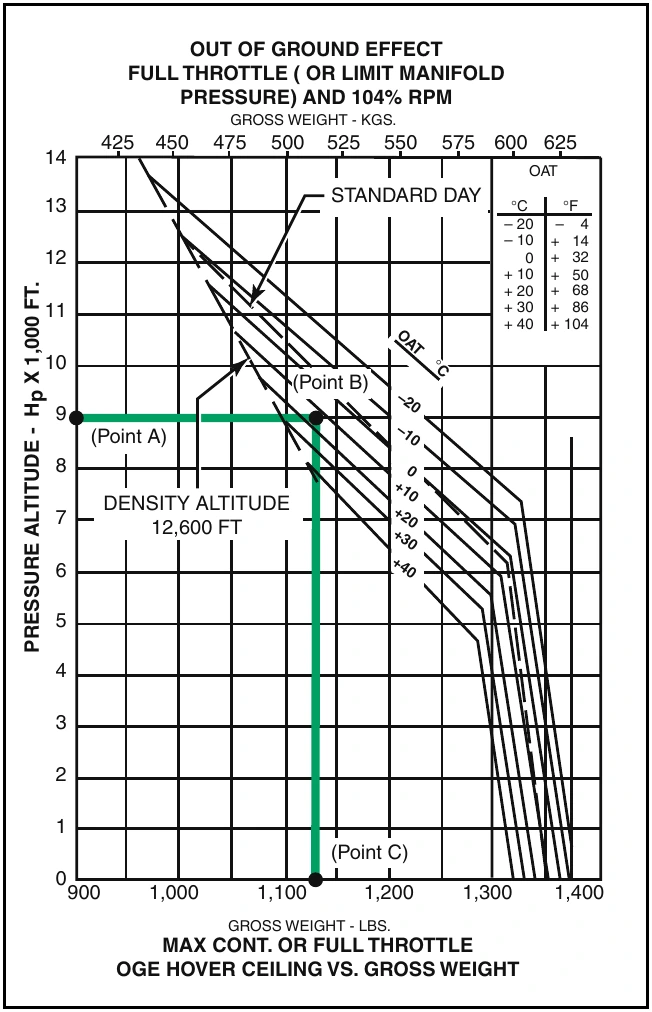
Helicopter performance revolves around whether or not the helicopter can be hovered. More power is required during the hover than in any other flight regime. Obstructions aside, if a hover can be maintained, a takeoff can be made, especially with the additional benefit of translational lift. Hover charts are provided for in ground effect (IGE) hover and out of ground effect (OGE) hover under various conditions of gross weight, altitude, temperature, and power. The “in ground effect” hover ceiling is usually higher than the “out of ground effect” hover ceiling because of the added lift benefit produced by ground effect.
In Ground Effect (IGE) Hover— Hovering close to the surface (usually less than one rotor diameter above the surface) under the influence of ground effect.
Out of Ground Effect (OGE) Hover— Hovering greater than one rotor diameter distance above the surface. Because induced drag is greater while hovering out of ground effect, it takes more power to achieve a hover. See Chapter 3—Aerodynamics of Flight for more details on IGE and OGE hover.
As density altitude increases, more power is required to hover. At some point, the power required is equal to the power available. This establishes the hovering ceiling under the existing conditions. Any adjustment to the gross weight by varying fuel, payload, or both, affects the hovering ceiling. The heavier the gross weight, the lower the hovering ceiling. As gross weight is decreased, the hover ceiling increases.
Sample Problem 1
You are to fly a photographer to a remote location to take pictures of the local wildlife. Using figure 8-2, can you safely hover in ground effect at your departure point with the following conditions?
Pressure Altitude..................................8,000 feet
Takeoff Gross Weight.....................1,250 pounds
First enter the chart at 8,000 feet pressure altitude (point A), then move right until reaching a point midway between the +10°C and +20°C lines (point B).
From that point, proceed down to find the maximum gross weight where a 2 foot hover can be achieved. In this case, it is approximately 1,280 pounds (point C).
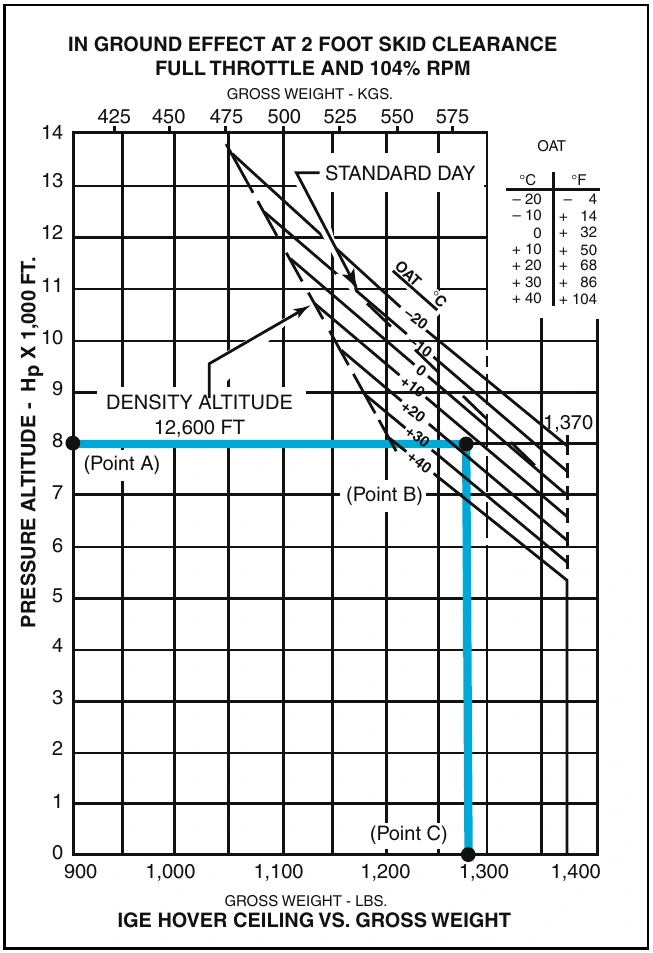
Since the gross weight of your helicopter is less than this, you can safely hover with these conditions.