
Chapter 8
Performance
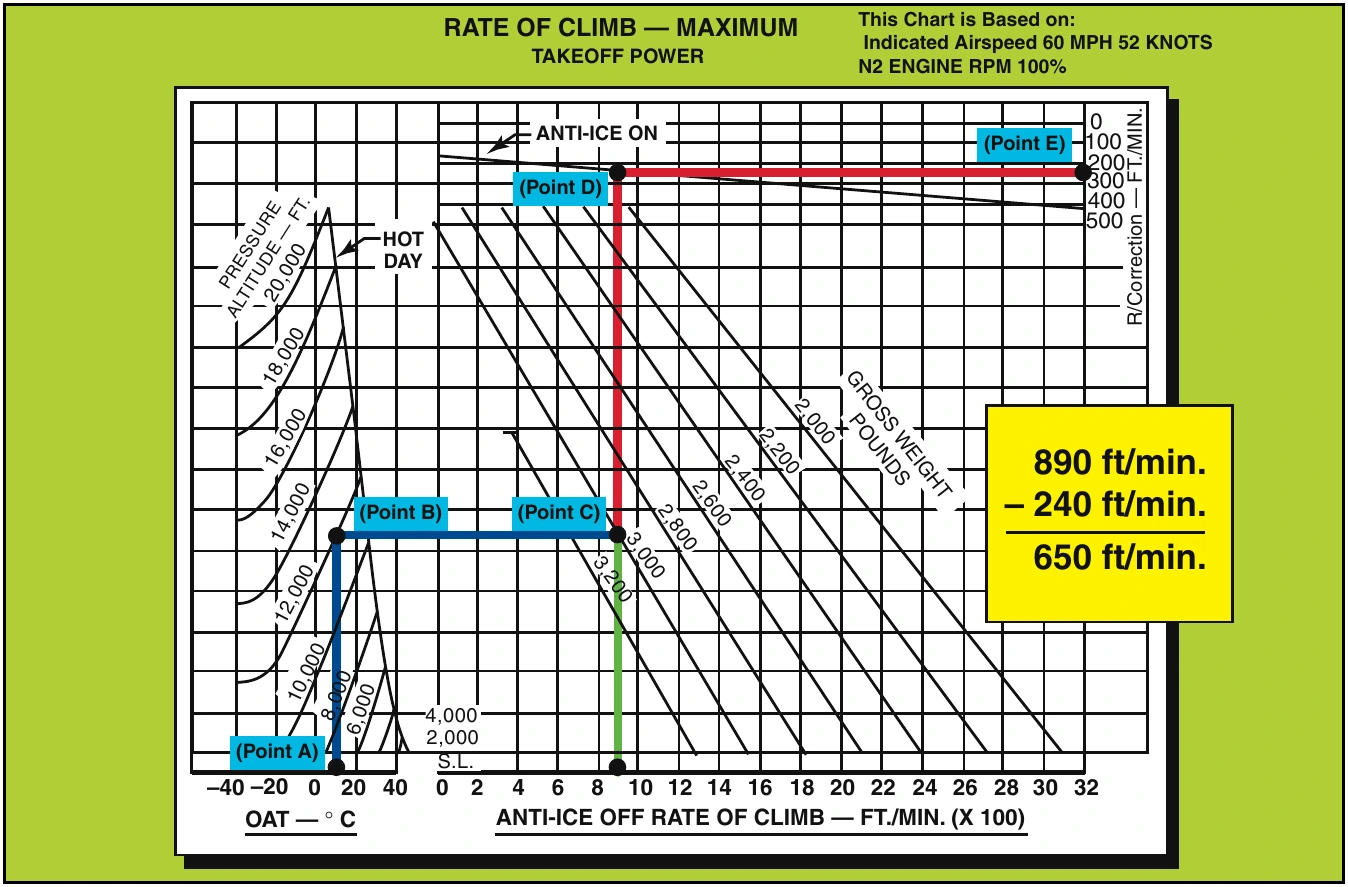
Pressure Altitude................................12,000 feet Outside Air Temperature...........................+10°C Gross Weight..................................3,000 pounds
Indicated Airspeed.................................52 knots
With this chart, first locate the temperature of +10°C (point A). Then proceed up the chart to the 12,000-foot pressure altitude line (point B). From there, move horizontally to the right until you intersect the 3,000-foot line (point C). With this performance chart, you must now determine the rate of climb with anti-ice off and then subtract the rate of climb change with it on. From point C, go to the bottom of the chart and find that the maximum rate of climb with anti-ice off is approximately 890 feet per minute. Then, go back to point C and up to the anti-ice-on line (point D). Proceed horizontally to the right and read approximately 240 feet per minute change (point E). Now subtract 240 from 890 to get a maximum rate of climb, with anti-ice on, of 650 feet per minute.
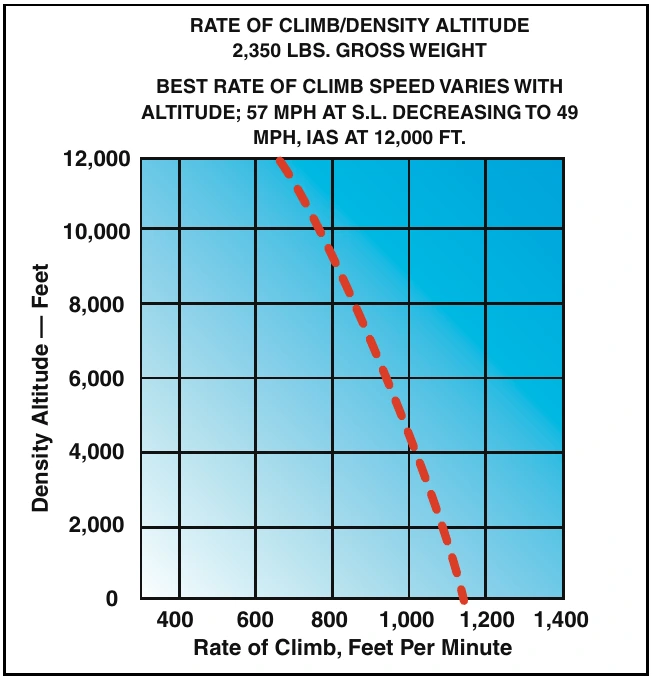
Other rate-of-climb charts use density altitude as a starting point. [Figure 8-6] While it cleans up the chart somewhat, you must first determine density altitude.
Notice also that this chart requires a change in the indicated airspeed with a change in altitude.