
Chapter 10
Engine Maintenance & Operation
To prevent loss of power, all openings to the cylinder must close and seal completely on the compression and power strokes. In this respect, there are three items in the proper operation of the cylinder that must be operating correctly for maximum efficiency. First, the piston rings must be in good condition to provide maximum sealing during the stroke of the piston. There must be no leakage between the piston and the walls of the combustion chamber. Second, the intake and exhaust valves must close tightly so that there is no loss of compression at these points. Third, and very important, the timing of the valves (opening and closing) must be such that highest efficiency is obtained when the engine is operating at its normal rated rpm. A failure at any of these points results in greatly reduced engine efficiency.
Fuel Metering
The induction system is the distribution and fuel-metering part of the engine. Obviously, any defect in the induction system seriously affects engine operation. For best operation, each cylinder of the engine must be provided with the proper air-fuel mixture, usually metered by the carburetor. On some fuel-injection engines, fuel is metered by the fuel injector flow divider and fuel-injection nozzles.
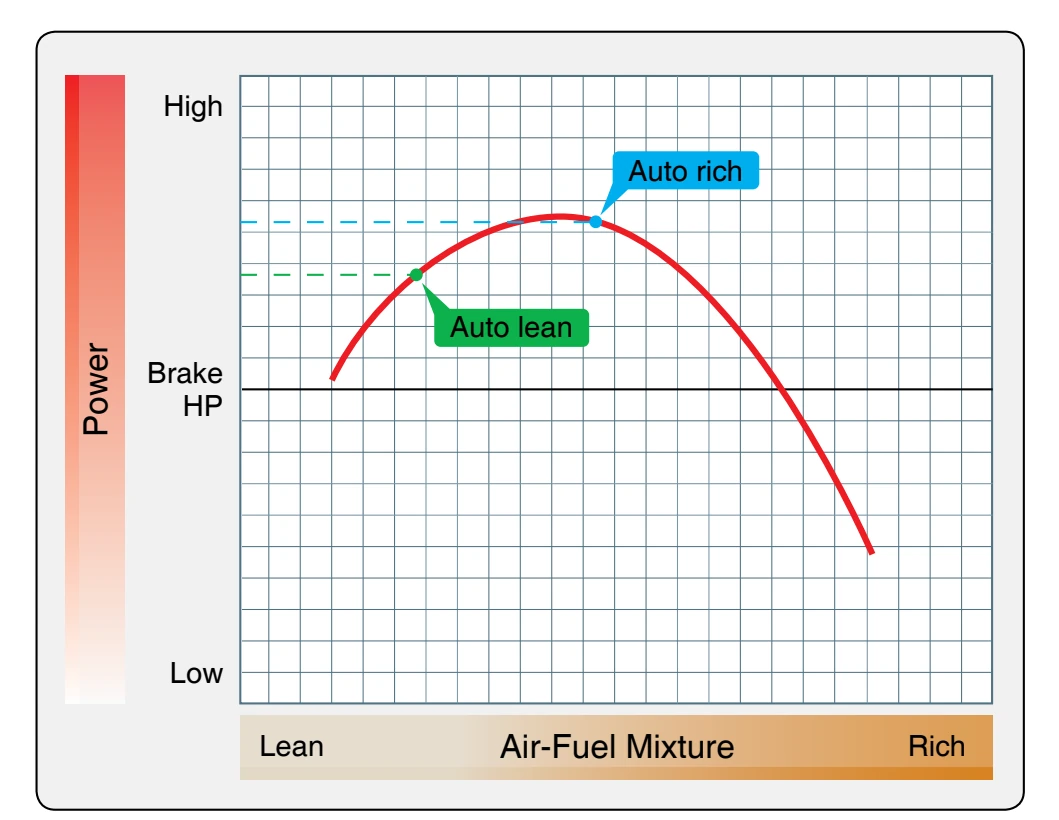
The relation between air-fuel ratio and power is illustrated in Figure 10-44. As the fuel mixture is varied from lean to rich, the power output of the engine increases until it reaches a maximum. Beyond this point, the power output falls off as the mixture is further enriched. This is because the fuel mixture is now too rich to provide perfect combustion. Note that maximum engine power can be obtained by setting the carburetor for one point on the curve.
In establishing the carburetor settings for an aircraft engine, the design engineers run a series of curves similar to the one shown. A curve is run for each of several engine speeds. If, for example, the idle speed is 600 rpm, the first curve might be run at this speed. Another curve might be run at 700 rpm, another at 800 rpm, and so on, in 100-rpm increments, up to takeoff rpm. The points of maximum power on the curves are then joined to obtain the best power curve of the engine for all speeds. This best power curve establishes the rich setting of the carburetor.
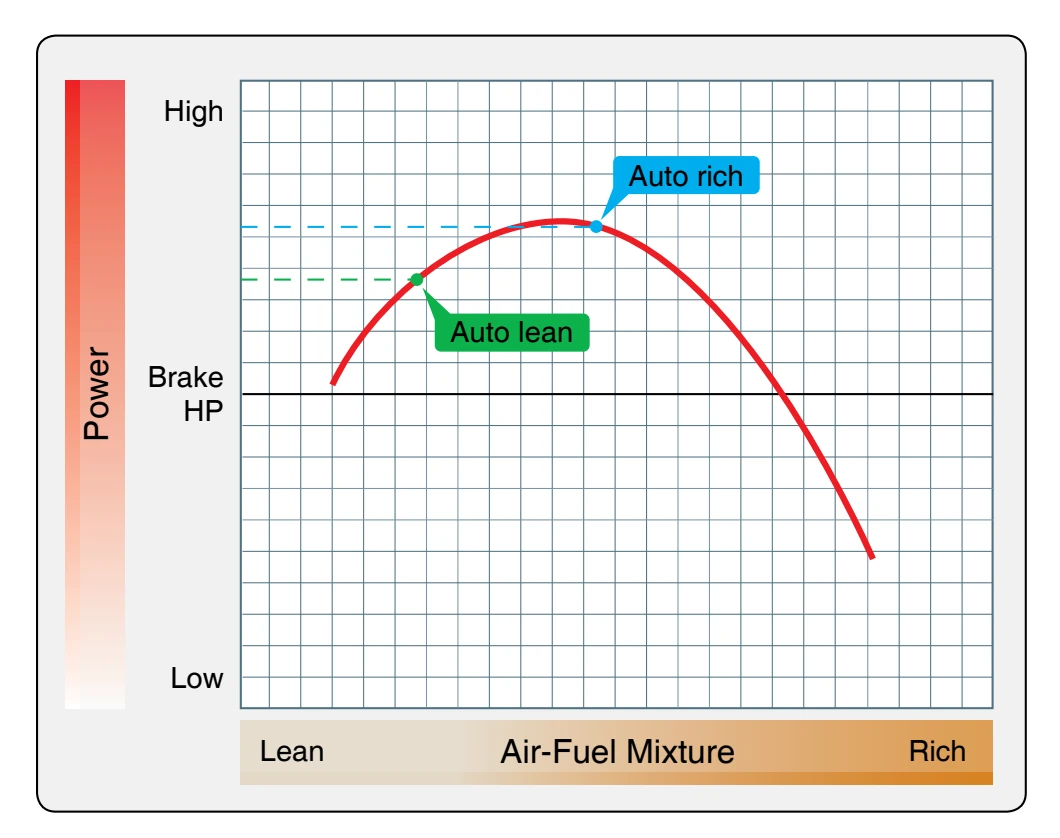
In establishing the detailed engine requirements regarding carburetor setting, the fact that the cylinder head temperature varies with air-fuel ratio must be considered. This variation is illustrated in the curve shown in Figure 10-45. Note that the cylinder head temperature is lower with the auto-lean setting than it is with the auto-rich mixture. This is exactly opposite common belief, but it is true. Furthermore, knowledge of this fact can be used to advantage by flight crews. If, during cruise, it becomes difficult to keep the cylinder head temperature within limits, the air-fuel mixture may be leaned out to get cooler operation. The desired cooling can then be obtained without going to auto-rich with its costly waste of fuel. The curve shows only the variation in cylinder head temperature. For a given rpm, the power output of the engine is less with the best-economy setting (auto-lean) than with the best-power mixture.
The decrease in cylinder head temperature with a leaner mixture holds true only through the normal cruise range. At higher power settings, cylinder temperatures are higher
with the leaner mixtures. The reason for this reversal hinges on the cooling ability of the engine. As higher powers are approached, a point is reached where the airflow around the cylinders do not provide sufficient cooling. At this point, a secondary cooling method must be used. This secondary cooling is done by enriching the air-fuel mixture beyond the best-power point. Although enriching the mixture to this extent results in a power loss, both power and economy must be sacrificed for engine cooling purposes.
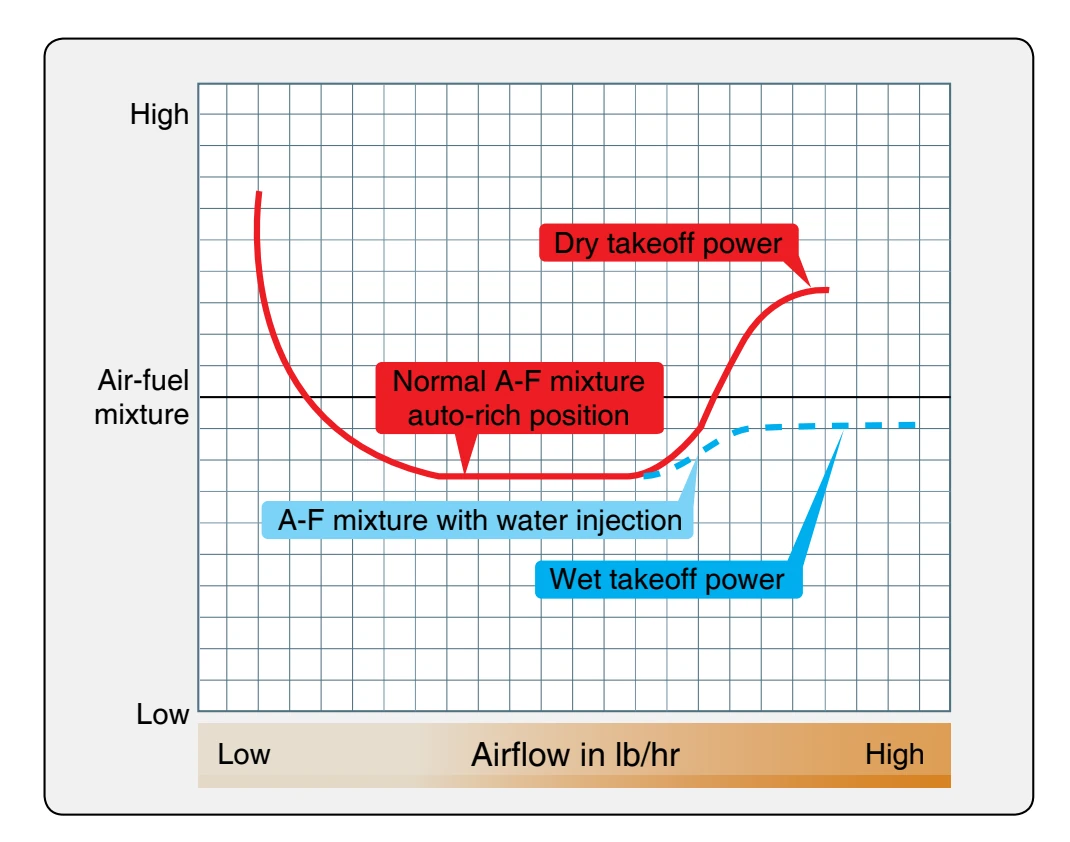
Many older, large, high-powered radial engines were influenced by the cooling requirements on air-fuel mixture, by effects of water injection. Figure 10-46 shows an air-fuel curve for a water-injection engine. The dotted portion of the curve shows how the air-fuel mixture is leaned out during water injection. This leaning is possible because water, rather than extra fuel, is used as a cylinder coolant. These types of systems are not used on modern aircraft.
This permits leaning out to approximately best-power mixture without danger of overheating or detonation. This leaning out gives an increase in power. The water does not alter the combustion characteristics of the mixture. Fuel added to the auto-rich mixture in the power range during dry operation is solely for cooling. A leaner mixture would give more power. Actually, water or, more accurately, the antidetonant (wateralcohol) mixture is a better coolant than extra fuel. Therefore, water injection permits higher manifold pressures and a still further increase in power.
In establishing the final curve for engine operation, the engine’s ability to cool itself at various power settings is, of course, taken into account. Sometimes the mixture must be altered for a given installation to compensate for the effect of cowl design, cooling airflow, or other factors on engine
cooling. The final air-fuel mixture curves take into account economy, power, engine cooling, idling characteristics, and all other factors that affect combustion.
Figure 10-47 shows a typical final curve for a float-type carburetor. Note that the air-fuel mixture at idle is the same in rich and in manual lean. The mixture remains the same until the low cruise range is reached. At this point, the curves separate and then remain parallel through the cruise and power ranges.
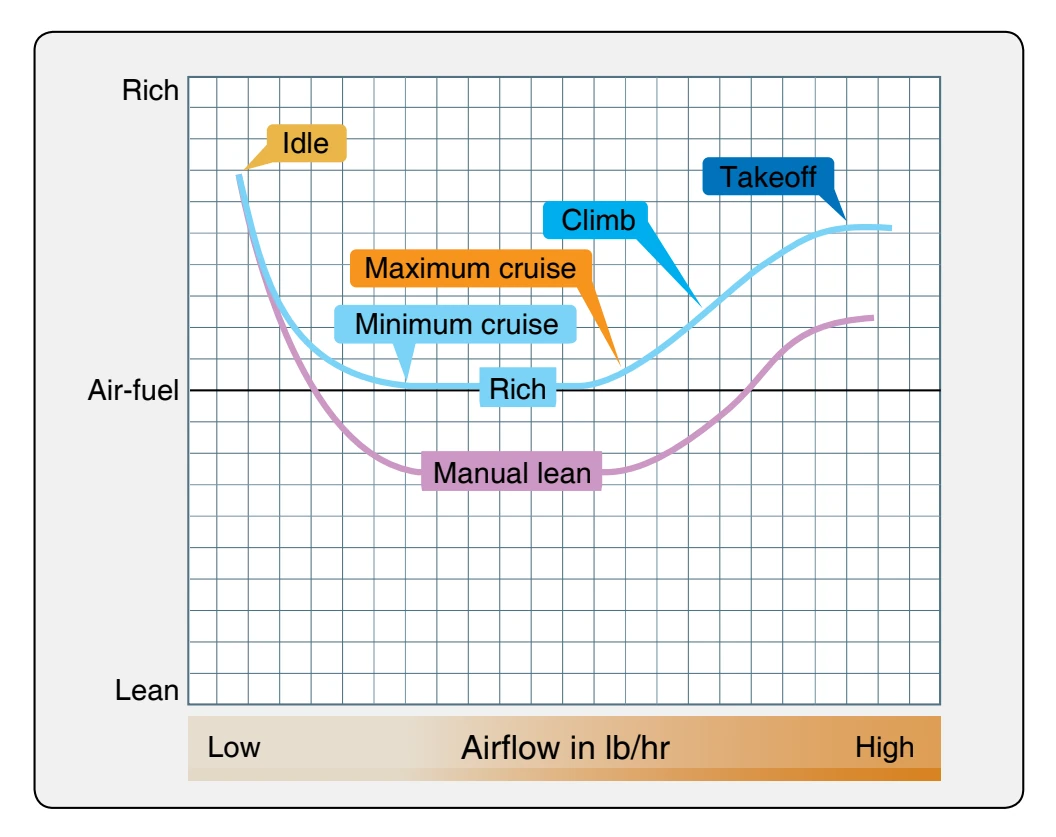
Therefore, any leaning out gives a mixture that is leaner than best power.