Chapter 24
Observations
The most useful information to be gained from the water vapor images is the location and movement of weather systems, jet streams, and thunderstorms. Another useful tidbit is aided by the color scale used on the images. In general, regions displayed in shades of red are very dry in the upper atmosphere and may correlate to crisp, blue skies from a ground perspective. On the contrary, regions displayed in shades of blue or green are indicative of a lot of high-level moisture and may also indicate cloudiness. This cloudiness could simply be high-level cirrus types or thunderstorms. That determination cannot be ascertained from this image by itself but could easily be determined when used in conjunction with corresponding visible and IR satellite images. A major advantage of the water vapor channel is that it can sense energy at night, so this imagery is available 24 hours a day.
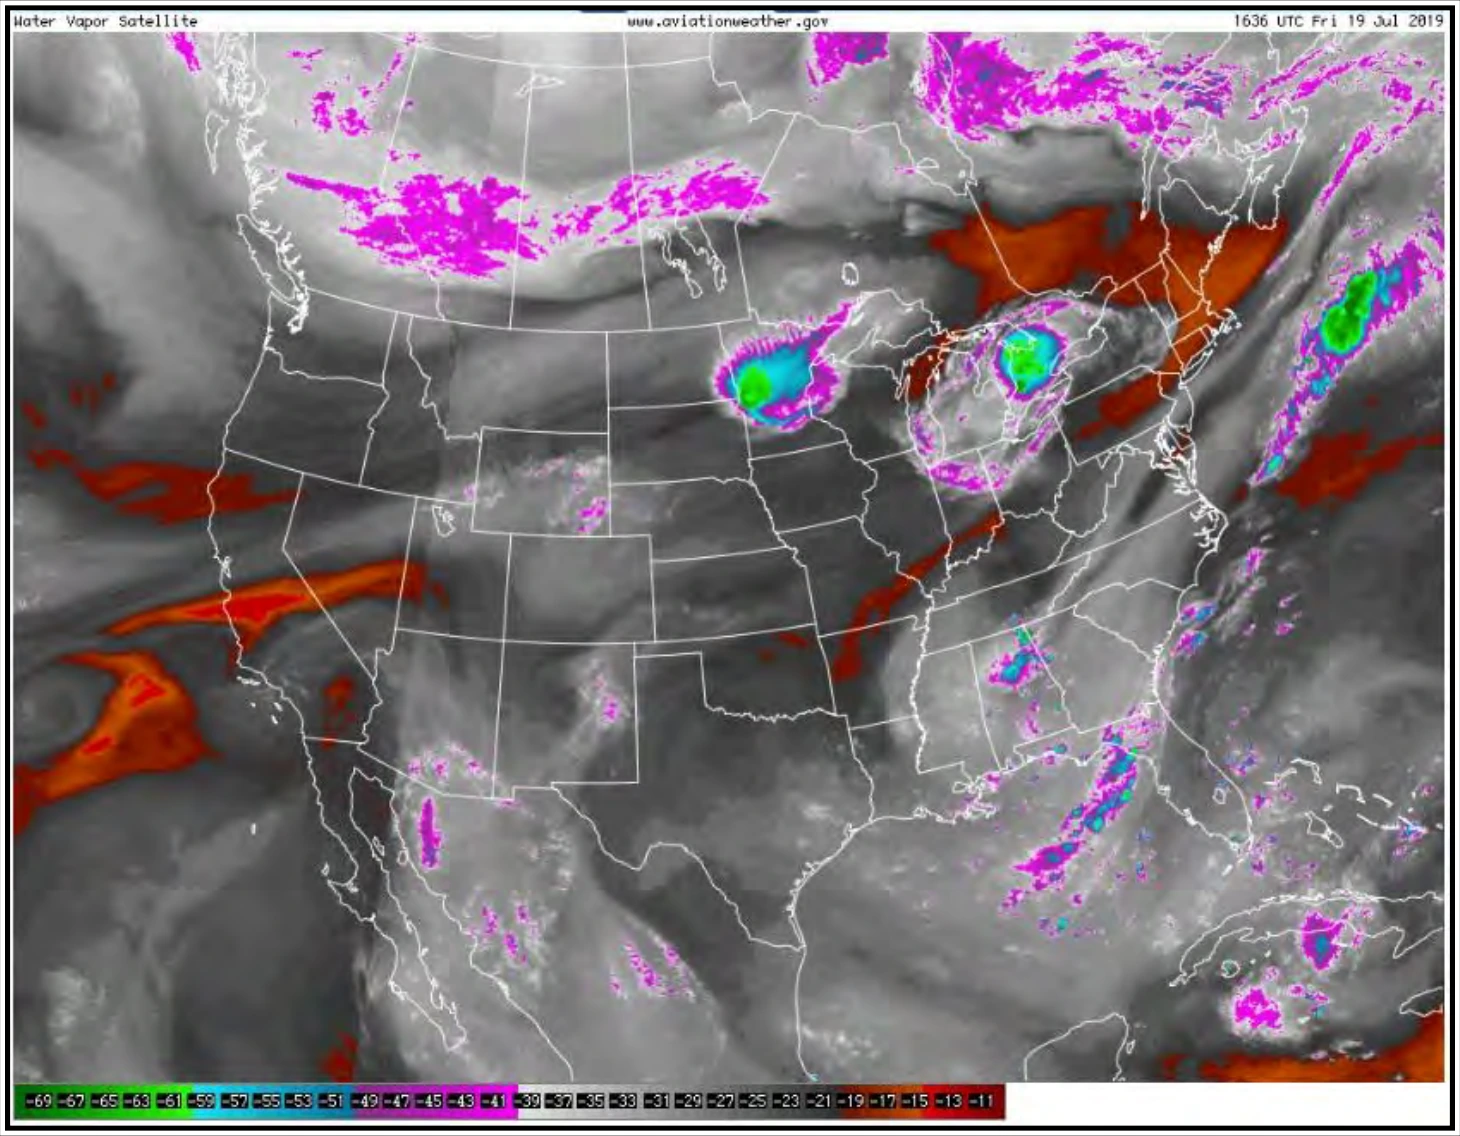
The scale is in degrees Celsius. Blue/green colors indicate moisture and/or clouds in the mid/upper troposphere, while dark gray/orange/red colors indicate dry air in the mid/upper troposphere.
24.7.2.4.1 Water Vapor Image Data Legend
The data legend on water vapor images is calibrated to temperature expressed in degrees Celsius (see Figure 24-25). The actual data values on the water vapor images are not particularly useful. Interpretation of the patterns and how they change over time is more important. The legend may vary depending on the satellite image provider.

The colors (values) represent temperature in degrees Celsius.
24.7.3 Polar Operational Environment Satellites (POES)
“POES” stands for the Polar Operational Environment Satellites. Polar satellites are not stationary. They track along various orbits around the poles. Typically, they are somewhere between 124 and 1,240 mi above the Earth’s surface. The satellites scan the Earth in swaths as they pass by on their tracks.
The NWS AAWU posts POES images on their website.
24.7.3.1 Benefits
Because polar satellites are so much closer to Earth, you can get very high resolution (i.e., better than 0.5 km (or about 5/8 mi)). This allows for weather and surface features to be seen in much greater detail.
This is particularly useful over the poles and arctic areas. The quality of geostationary satellite data degrades the closer you get to the poles, while polar satellite data provides high resolution in those areas.
24.7.3.2 Shortfalls
By far the most significant shortfall is the latency, or the time between the satellite scanning the area and the time that the data is available to a user. Because polar satellites are moving, they cannot continuously transmit to a single station. Instead, there is a series of stations around the globe through which the data is collected. Data is then transmitted from those stations to other locations. At times, it can be several hours old (or more) by the time it reaches operational users in the United States (in polar areas it is much quicker). There are some direct ground stations closer to the United States that can cut the latency to about 45 minutes when utilizing the newer polar satellites.
24.8 Upper Air Observations
24.8.1 Radiosonde Observations (Weather Balloon)
Since the late 1930s, the NWS has taken routine scheduled upper air observations with radiosondes attached to weather balloons, usually referred to as soundings. Weather data from the radiosondes are foundational to all computer model forecasts produced by the NWS and others.
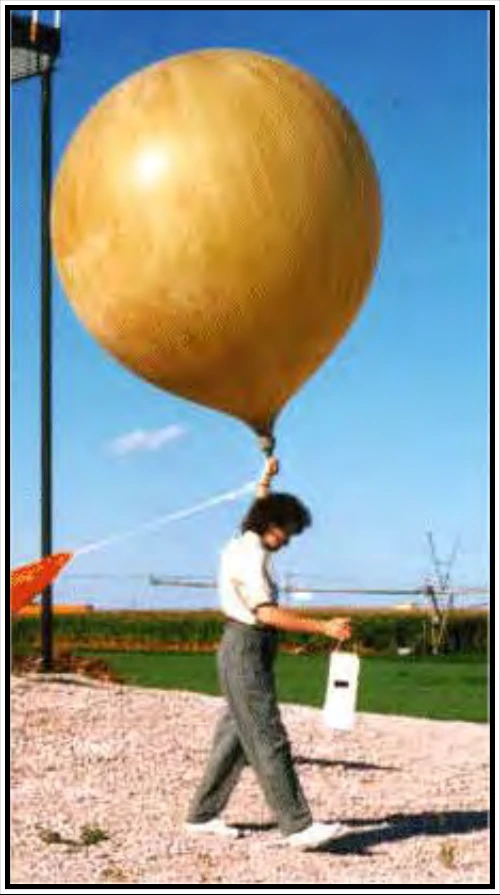
The radiosonde is a small, expendable instrument package (weighing 100 to 500 g) that consists of radio gear and sensing elements and is suspended below a large balloon inflated with hydrogen or helium gas (see Figure 24-26). As the radiosonde rises at about 300 m per minute (about 1,000 ft per minute), sensors on the radiosonde measure profiles of pressure, temperature, and moisture. These sensors are linked to a battery-powered radio transmitter that sends the sensor measurements to a ground tracking antenna. Wind speed and direction aloft are also obtained by tracking the position of the radiosonde in flight using the GPS. Most stations around the world take rawinsonde observations. However, meteorologists and other data users frequently refer to a rawinsonde observation as a radiosonde observation.