
Chapter 24
Observations
The data legend on a visible image displays albedo, or reflectance, expressed as a percentage (see Figure 24-19). For example, an albedo of 72 means 72 percent of the sunlight that struck a feature was reflected back to space.

The gray shades (values) represent albedo, or reflectance, expressed as a percentage.
24.7.2.3 Infrared (IR) Imagery
IR images (see Figure 24-20 and Figure 24-21) display temperatures of the Earth’s surface, clouds, and particulate matter. Generally speaking, the warmer an object, the more IR energy it emits. The satellite sensor measures this energy and calibrates it to temperature using a very simple physical relationship.
Clouds that are very high in the atmosphere are generally quite cold (e.g., -50°C), whereas clouds very near the Earth’s surface are generally quite warm (e.g., +5°C). Likewise, land may be even warmer than the lower clouds (e.g., +20°C). Those colder clouds emit much less IR energy than the warmer clouds, and the land emits more than those warm clouds.
The data measured by satellite is calibrated and colorized according to the temperature. If the temperature of the atmosphere decreases with height (which is typical), cloud-top temperature can be used to roughly determine which clouds are high-level and which are low-level.
When clouds are present, the temperature displayed on the IR images is that of the tops of clouds. When clouds are not present, the temperature is that of the ground or the ocean. A major advantage of the IR channel is that it can sense energy at night; therefore, this imagery is available 24 hours a day.
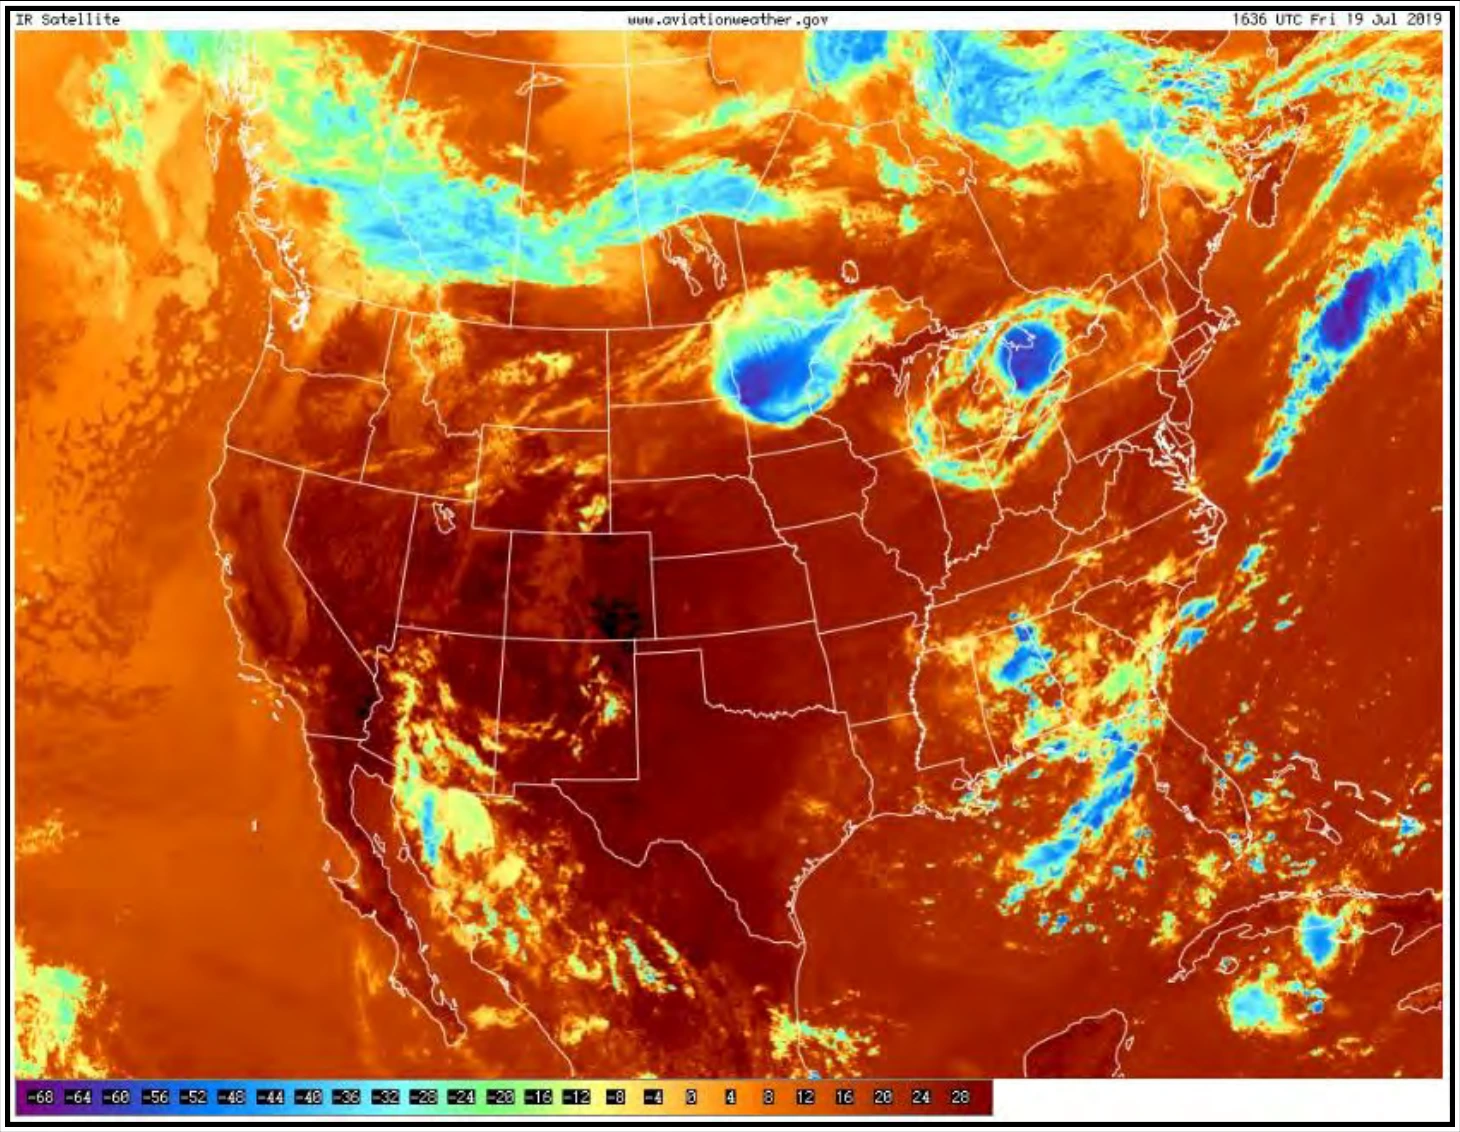
The scale is in degrees Celsius. Blue/purple colors indicate colder temperatures, while orange/red colors indicate warmer temperatures.
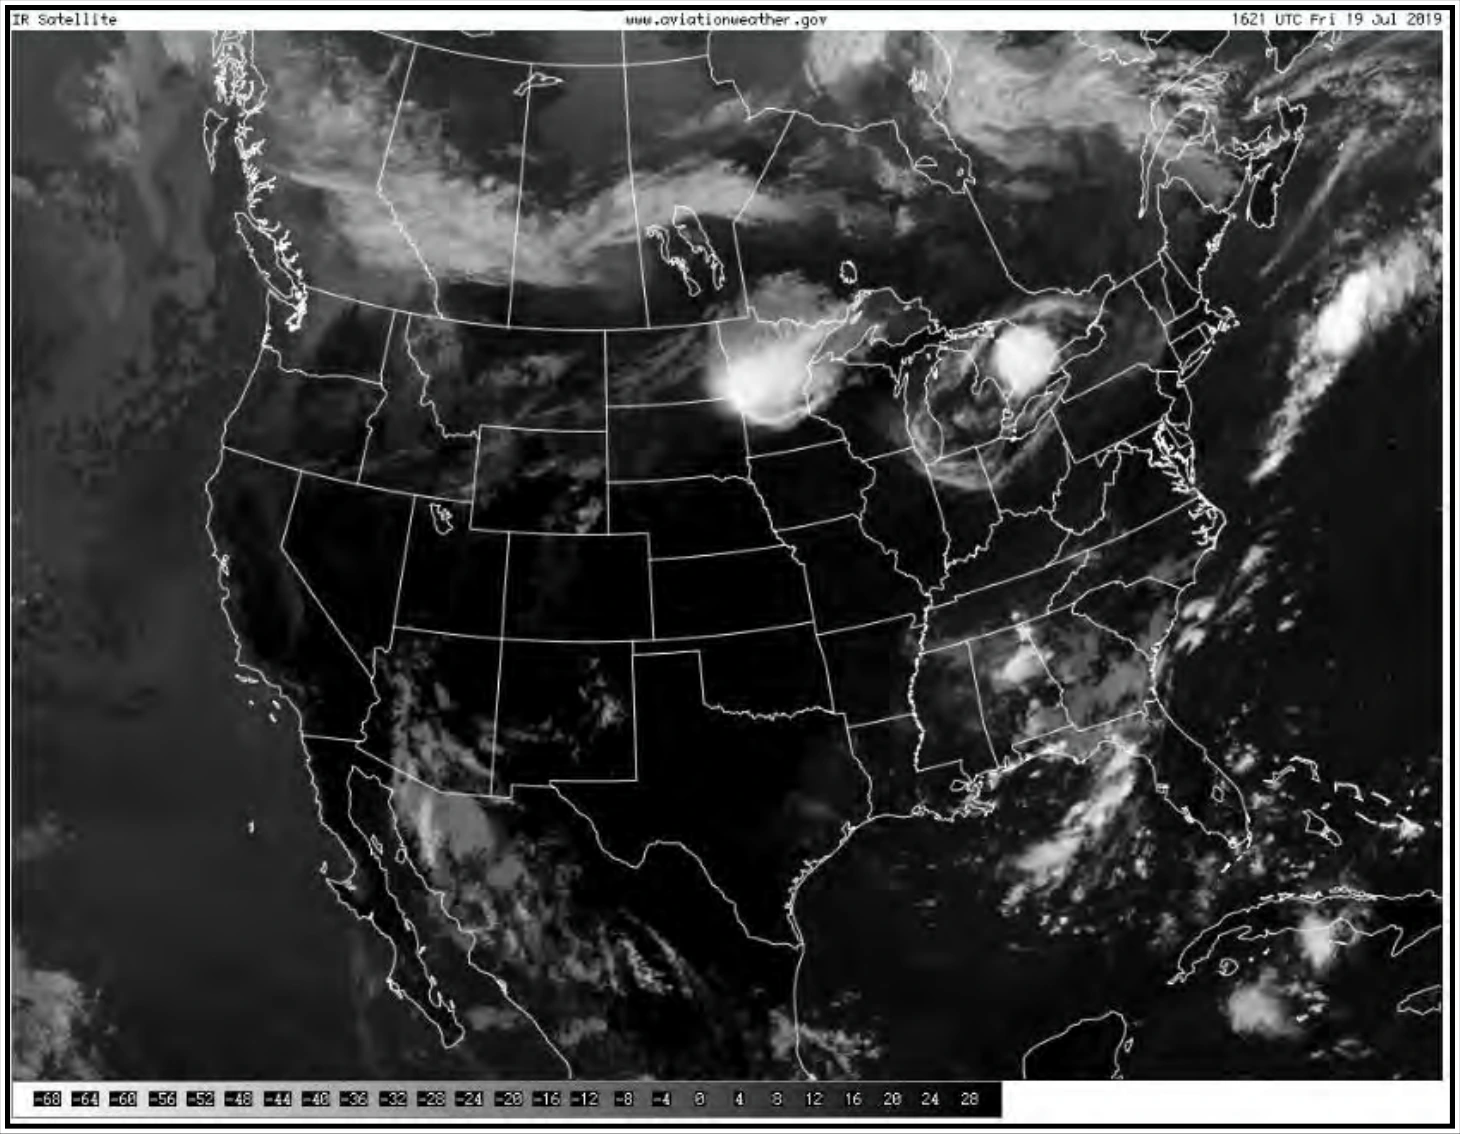
The scale is in degrees Celsius. Lighter gray shades indicate colder temperatures, while darker gray shades indicate warmer temperatures.
24.7.2.3.1 Infrared Image Data Legends
The data legend on an IR image is calibrated to temperature expressed in degrees Celsius (see Figure 24-22 and Figure 24-23). The legend may vary based on the satellite image provider.

The colors (values) represent temperature in degrees Celsius.

The gray shades (values) represent temperature in degrees Celsius.
24.7.2.4 Water Vapor Imagery
Water vapor imagery (see Figure 24-24) displays the quantity of water vapor generally located in the middle and upper troposphere within the layer between 700 mb (approximately 10,000 ft MSL) and 200 mb (approximately FL390). The actual numbers displayed on the water vapor images correspond to temperature in degrees Celsius. No direct relationship exists between these values and the temperatures of clouds, unlike IR imagery. Water vapor imagery does not really “see” clouds, but “sees” high-level water vapor instead.