Chapter 25
Analysis
25.1 Introduction
The second of five types of aviation weather information discussed in this handbook are analyses. Analyses of weather information are an enhanced depiction and/or interpretation of observed weather data. Prior to the 1990s, most analysis charts were hand-drawn by forecasters. Today’s analyses are automated, and depending on the weather information provider (e.g., the NWS, commercial weather services, and flight planning services), the appearance and content of these analyses will vary.
This chapter will only focus on those analyses produced by the NWS and made available on various websites, including the AWC, the WPC, the Ocean Prediction Center (OPC), and the AAWU.
For this handbook, analyses include the following:
- Surface Chart Analysis.
- Upper Air Analysis.
- Freezing Level Analysis.
- Icing Analysis [Current Icing Product (CIP)].
- Turbulence [Graphical Turbulence Guidance (GTG)] Analysis.
- Real-Time Mesoscale Analysis (RTMA).
We recognize that in today’s world, an increasing amount of analyzed weather information is available from multiple sources. These sources provide a wide range of meteorological data, such as surface observations, radar, and satellite imagery, and use advanced techniques to combine these inputs into accurate, high-resolution weather analyses products. These high-resolution analyses products can provide METAR-equivalent data (ceiling, visibility, temperature, dew point pressure, wind direction, wind speed) across grid that extend well beyond airport locations.
Analyzed Surface Weather information refers to weather data from sources other than the currently approved ground-based ASOS and AWOS weather reporting systems. Alternate sources may include:
- Model-derived, gridded estimates of current conditions,
- In situ observations from novel data sources, such as UAS or weather cameras, and
- Surface sensors that are currently not approved for producing METARs.
FAA Flight Standards has investigated the use of Analyzed Weather Information since 2015 as an alternative source of weather information when elements are missing from ASOS and AWOS reports. In May of 2024, Flight Standards completed a Safety Risk Management Panel (SRMP) to assess the risk of using Analyzed Weather Information (for all required weather elements) for Part 121 and 135 operations when sensed weather is not available (i.e., no ASOS/AWOS sensor) or missing (i.e., incomplete weather information from an ASOS/AWOS METAR). The Safety Risk Management Document (SRMD) concludes that implementation of identified mitigations to address performance variability of the analyzed weather information (to include latency and geographic variability), all hazards would be reduced to a low risk level, equivalent to current operational standards in the NAS regarding Weather Information. Results of the SRMP supports a path forward to enable the use of Analyzed Weather as an approved source of weather information when weather information is not available from an ASOS or AWOS.
At terminal locations that provide METARs, occasionally the information required for flight operations is missing and this impacts the ability to sustain operations. Improved back-up information from an approved weather source is required for efficiency and to sustain safe operations. In an effort to mitigate these disruptions, since 2015, Flight Standards approved the use of NWS Real-Time Mesoscale Analysis (RTMA) for operators to use temperature information at airports where an ASOS/AWOS has failed. In early 2024, Flight Standards also approved the use of Altimeter Setting (pressure) information at airports where an ASOS/AWOS has failed. More details on RTMA are in Section 25.7.
With the assumption that a METAR is representative of weather within five miles of the terminal area where the METAR is taken, this equates to two percent of Alaska and three percent of the lower 48 contiguous United States having “Certified Weather” information from “Approved Sources” at airports where a METAR is produced. Certified weather systems from approved sources are too expensive to fill these gaps across the NAS. However, utilizing existing FAA certified sensors from approved sources with these other various types of meteorological data from multiple sources could easily help fill this gap.
25.2 Weather Charts
A weather chart is a map on which data and analyses are presented that describe the state of the atmosphere over a large area at a given moment in time.
The possible variety of such charts is enormous, but in meteorological history there has been a more or less standard set of charts, including surface charts and the constant-pressure charts of the upper atmosphere. Because weather systems are three dimensional (3D), both surface and upper air charts are needed. Surface weather charts depict weather on a constant-altitude (usually sea level) surface, while upper air charts depict weather on constant-pressure surfaces.
The NWS produces many weather charts that support the aviation community.
25.2.1 Weather Observation Sources
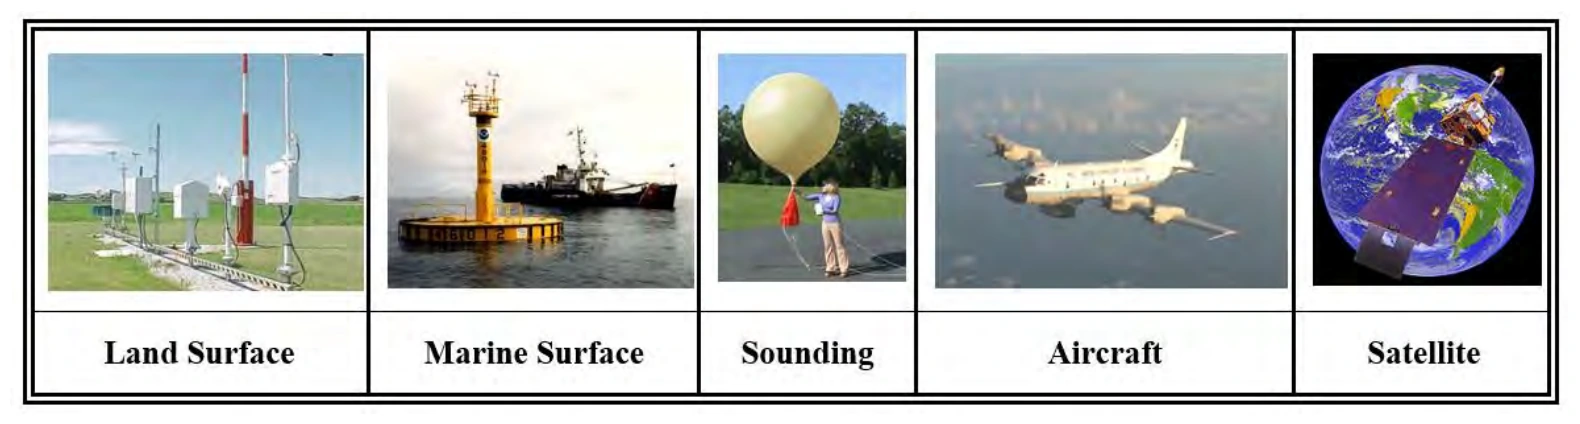
Weather analysis charts can be based on observations from a variety of data sources (see Figure 25-1), including:
- Land surface [e.g., ASOS, AWOS, and the National Mesonet].
- Marine surface [e.g., ship, buoy, Coastal-Marine Automated Network (C-MAN), and tide gauge].
- Sounding [e.g., radiosonde, dropsonde, pibal, profiler, and Doppler weather radar Velocity Azimuth Display (VAD) wind profile].
- Aircraft [e.g., AIREPs and PIREPs), AMDAR, and Aircraft Communications Addressing and Reporting System (ACARS)].
- Satellite [e.g., GOES sensors that provide temperature, moisture, and wind (through cloud movement)].