Chapter 25
Analysis
25.2.2 Analysis
Analysis is the drawing and interpretation of the patterns of various elements on a weather chart. It is an essential part of the forecast process. If meteorologists do not know what is currently occurring, it is nearly impossible to predict what will happen in the future. Computers have been able to analyze weather charts for many years and are commonly used in the process. However, computers cannot interpret what they analyze. Thus, many meteorologists still perform a subjective analysis of weather charts when needed.
25.2.2.1 Analysis Procedure
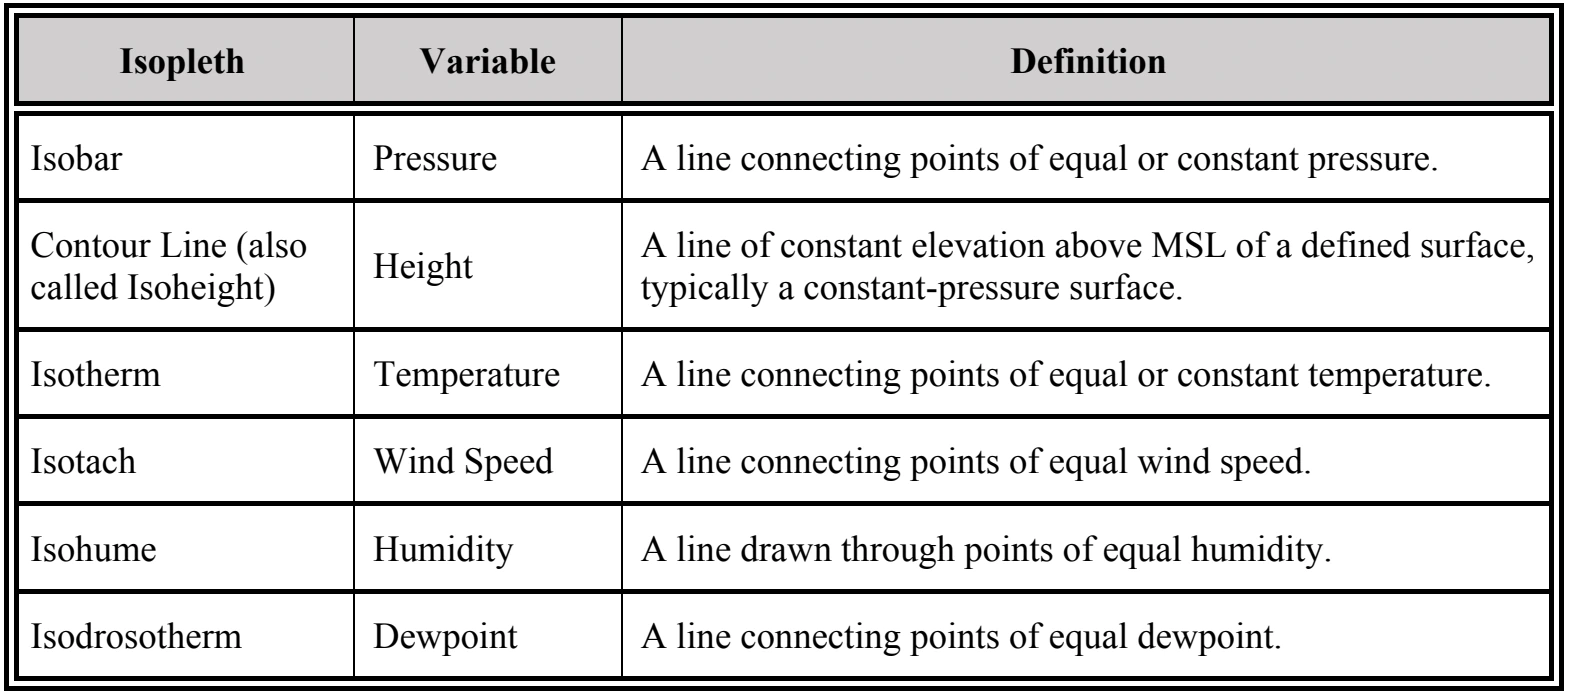
The analysis procedure is similar to drawing in a dot-to-dot coloring book. Just as one would draw a line from one dot to the next, analyzing weather charts is similar in that lines of equal values, or isopleths, are drawn between dots representing various elements of the atmosphere. An isopleth is a broad term for any line on a weather map connecting points with equal values of a particular atmospheric variable. See Table 25-1 for common isopleths.
The weather chart analysis procedure begins with a map of the plotted data, which is to be analyzed (see Figure 25-2). It is assumed that bad or obviously incorrect data has been removed before beginning the analysis process. At first, the chart will appear to be a big jumble of numbers. However, when the analysis procedure is complete, patterns will appear, and significant weather features will be revealed.
25.2.2.1.1 Step 1: Determine the Optimal Contour Interval and Values to be Analyzed
The first step in the weather chart analysis procedure is to identify the maxima and minima data values and their ranges to determine the optimal contour interval and values to be analyzed. The best contour interval will contain enough contours to identify significant weather features, but not so many that the chart becomes cluttered. Each weather element has a standard contour interval on NWS weather charts, but these values can be adjusted in other analyses as necessary.
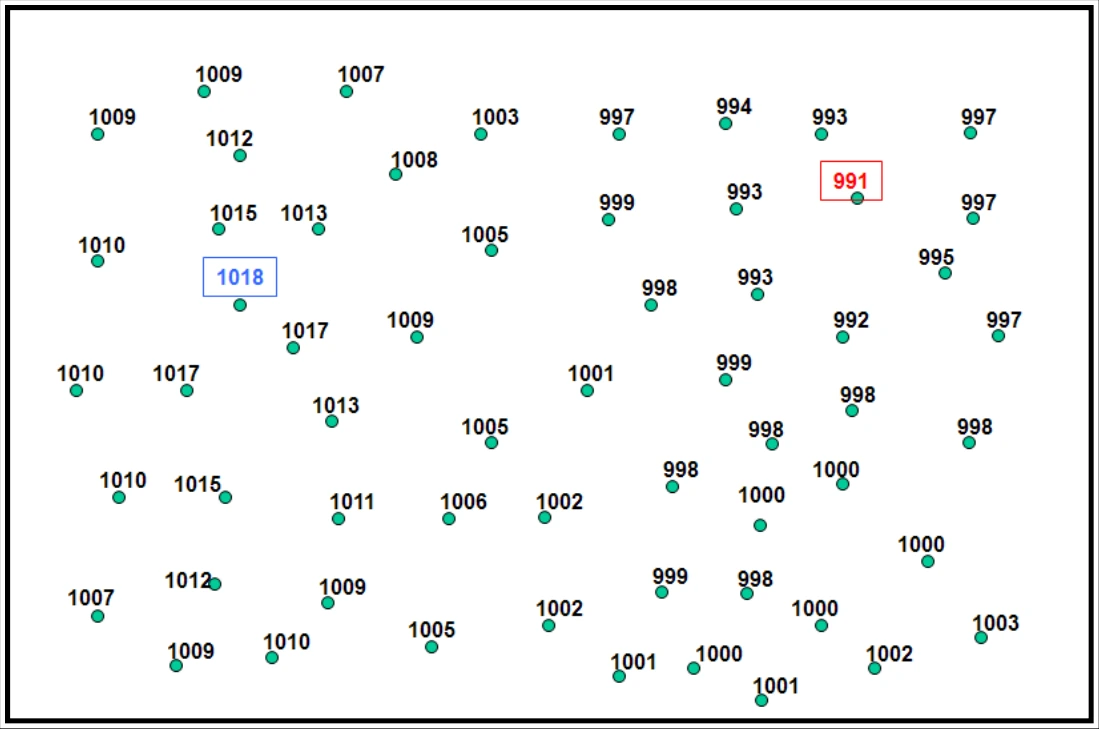
Every contour value must be evenly divisible by the contour interval. So, for example, if the contour interval is every four units, a 40-unit contour is all right, but a 41-unit contour is not. In the surface pressure analysis example shown in Figure 25-2, an isobar analysis will be performed beginning at a value of 992 mb and using a contour interval of four mb, which is standard on the NWS Surface Analysis Chart.
25.2.2.1.2 Step 2: Draw the Isopleths and Extrema
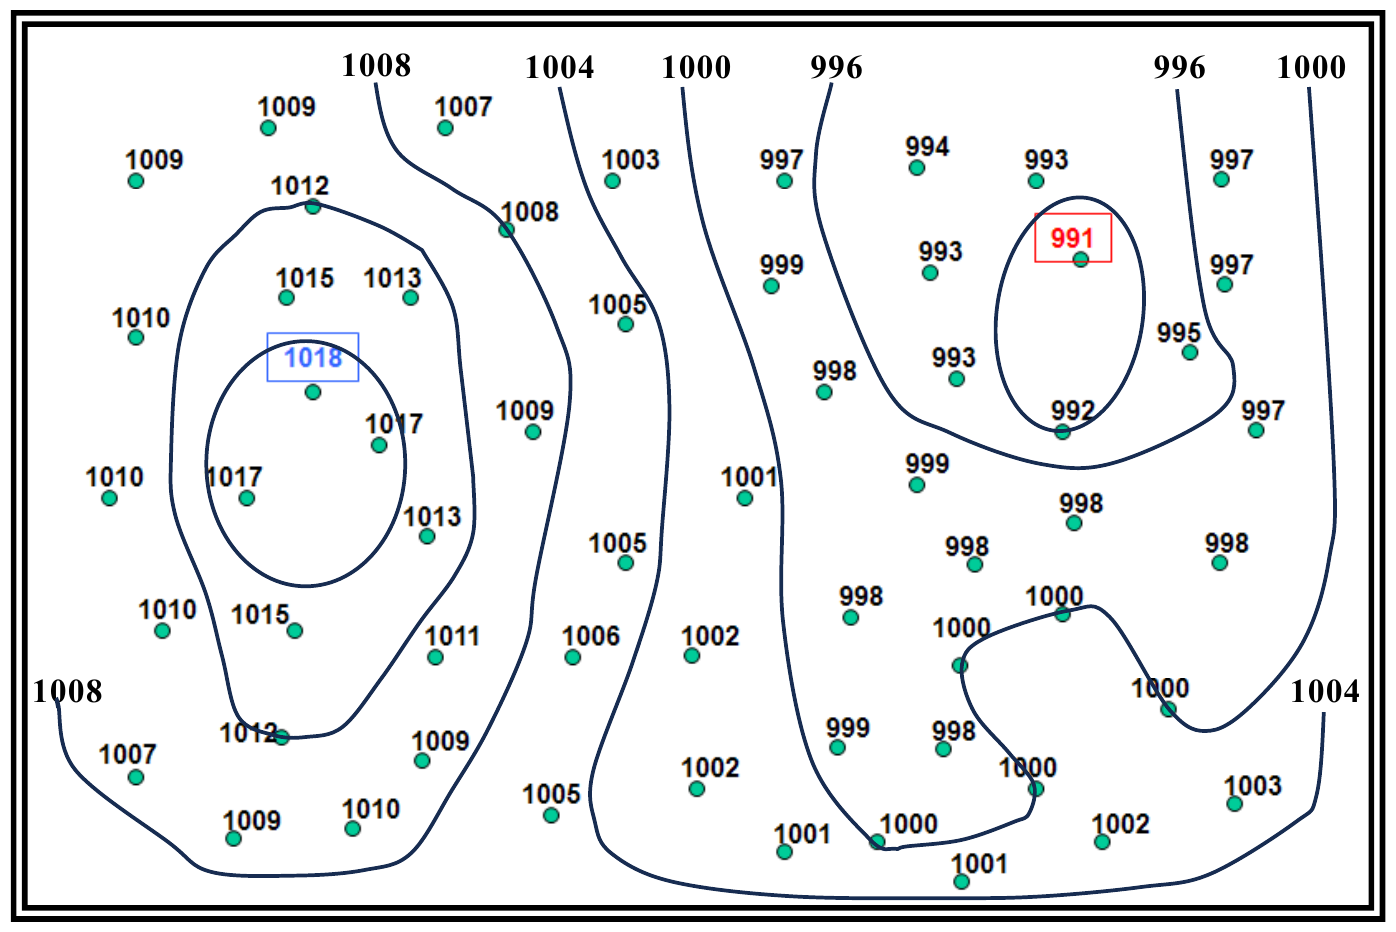
The second step is to draw the isopleths and extrema (maxima and minima) using the beginning contour value and contour interval chosen in the first step (see Figure 25-3). It is usually easiest to begin drawing an isopleth either at the edge of the data domain (edge of the chart) or at a data point that matches the isopleth value being drawn. Interpolation must often be used to draw isopleths between data points and determine the extrema. “Interpolate” means to estimate a value within an interval between known values.
When drawing isopleths and extrema on a weather chart, certain rules must be followed:
- The analysis must remain within the data domain. Analysis must never be drawn beyond the edge of the chart where there are no data points. That would be guessing.
- Isopleths must not contain waves and kinks between two data points. This would indicate a feature too small to be supported by the data. Isopleths should be smooth and drawn generally parallel to each other.
- When an isopleth is complete, all data values must be higher than the isopleth’s value on one side of the line and lower on the other.
- A closed-loop isopleth must contain an embedded extremum (maximum or minimum).
- When a maximum (minimum) is identified, data values must decrease (increase) in all directions away from it.
- Isopleths can never overlap, intersect, or cross over extrema. It is impossible for one location to have more than one data value simultaneously.
- Each isopleth must be labeled. A label must be drawn wherever an isopleth exits the data domain. For closed-loop isopleths, a break in the loop must be created where a label can be drawn. For very long and/or complex isopleths, breaks should be created where additional labels can be drawn, as necessary.
- Extrema must be labeled. Extrema are often denoted by an “x” embedded within a circle. Beneath the label, the analyzed value of the field must be written and underlined.
- Isopleths and labels should not be drawn over the data point values. If necessary, breaks in the isopleths should be created so that the data point values can still be read.
25.2.2.1.3 Step 3: Identify Significant Weather Features
The third (and final) step is to interpret significant weather features. The conventional labels for extrema are H (high) and L (low) for pressure and height, W (warm) and K (cold) for temperature (they stand for the German words for warm and cold), and X (maxima) and N (minima) for all other elements. Tropical storms, hurricanes, and typhoons are low-pressure systems with their names and central pressures denoted. Troughs, ridges, and other significant features are often identified as well.
For surface analysis charts, positions and types of fronts are shown by symbols in Figure 25-4. The symbols on the front indicate the type of front and point in the direction toward which the front is moving. Two short lines across a front indicate a change in front type.
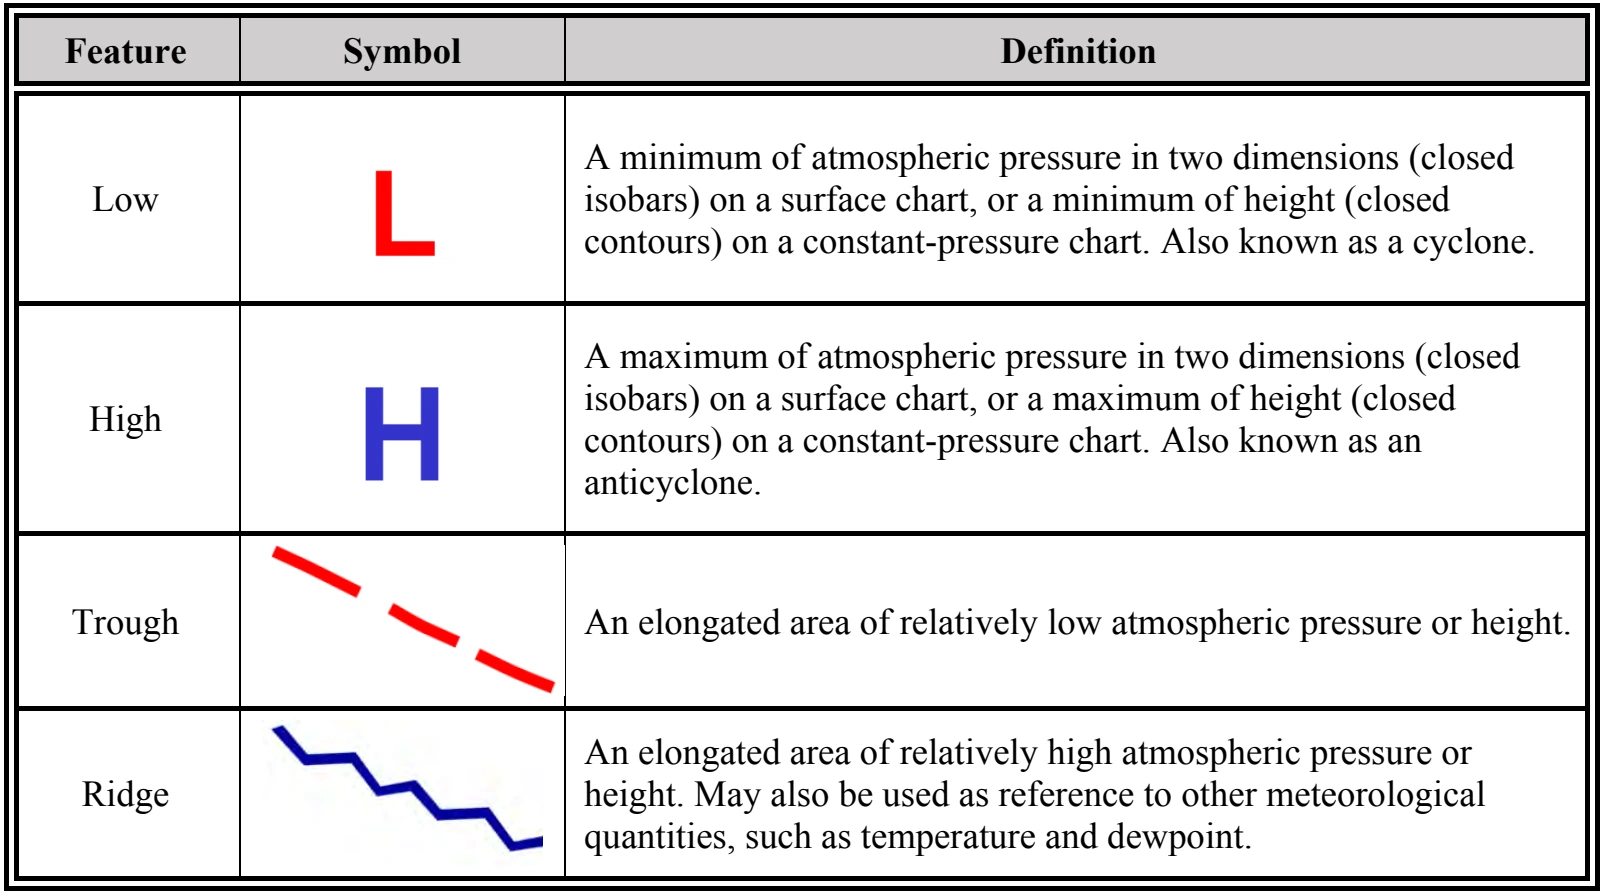
Table 25-2 provides the most common weather chart symbols. In the surface pressure analysis in Figure 25-4, a high, low, trough, and ridge have been identified.