Chapter 25
Analysis
25.2.3 Surface Analysis Chart
The WPC in College Park, MD, produces a variety of surface analysis charts for North America that are available on their website. The WPC’s surface analysis is also available on the AWC’s and other providers’ websites.
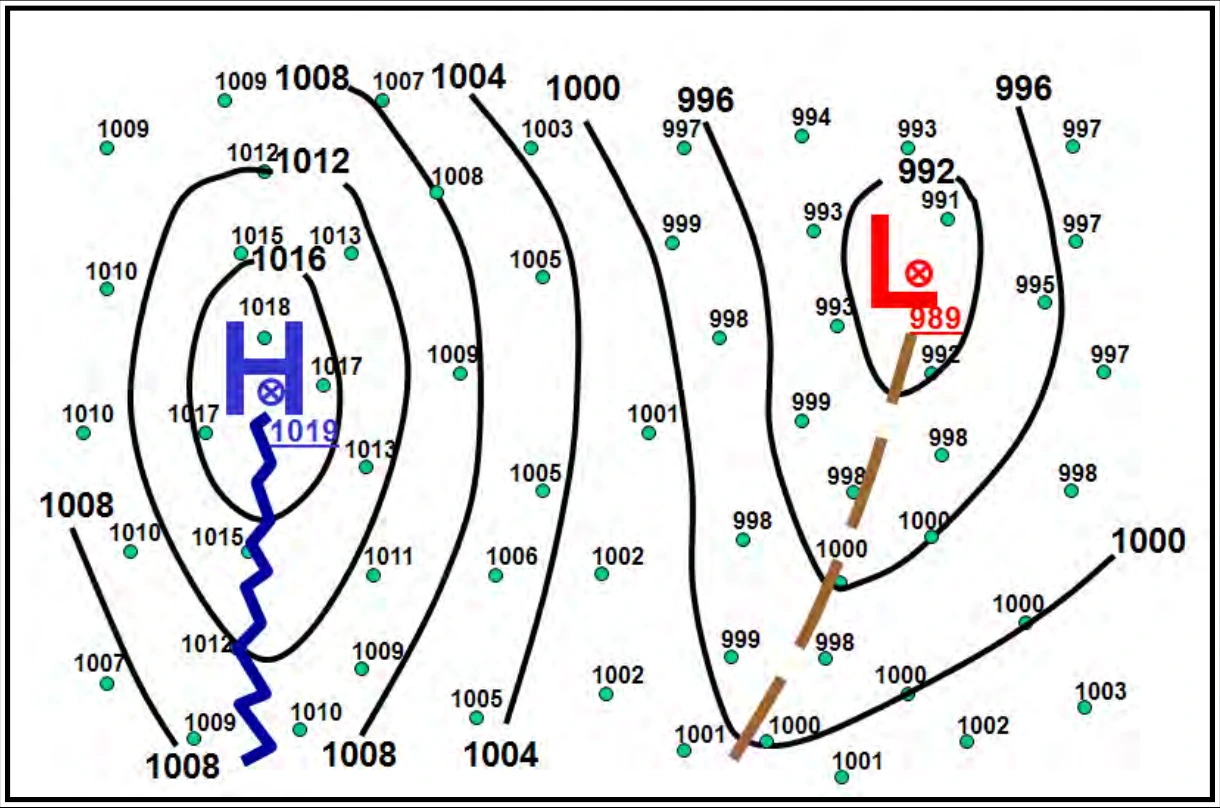
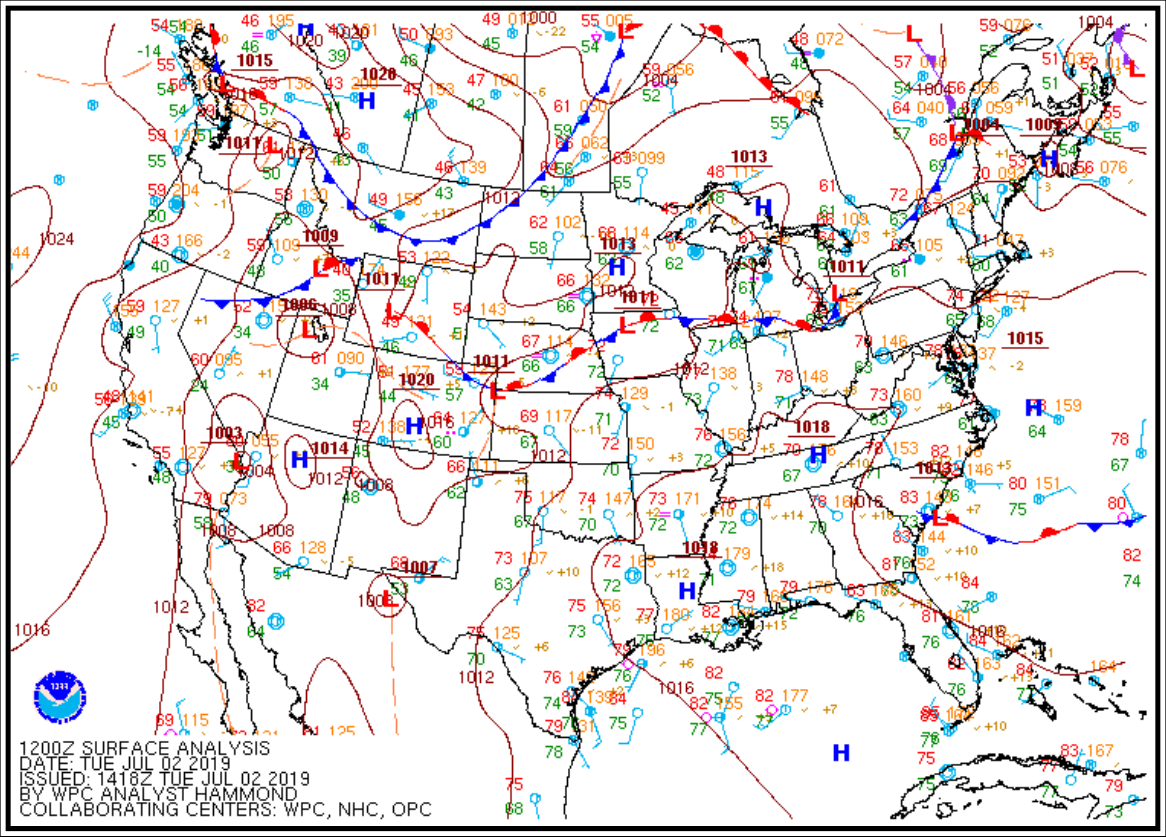
A surface chart (also called surface map or sea level pressure chart) is an analyzed chart of surface weather observations. Essentially, a surface chart shows the distribution of sea level pressure (lines of equal pressure are isobars). Hence, the surface chart is an isobaric analysis showing identifiable, organized pressure patterns. The chart also includes the positions of highs, lows, ridges, and troughs, and the location and character of fronts and various boundaries, such as drylines, outflow boundaries, and sea breeze fronts. Although the pressure is referred to as MSL, all other elements on this chart are presented as they occur at the surface point of observation. A chart in this general form is the one commonly referred to as the weather map. See Figure 25-5 for a schematic example of a surface chart.
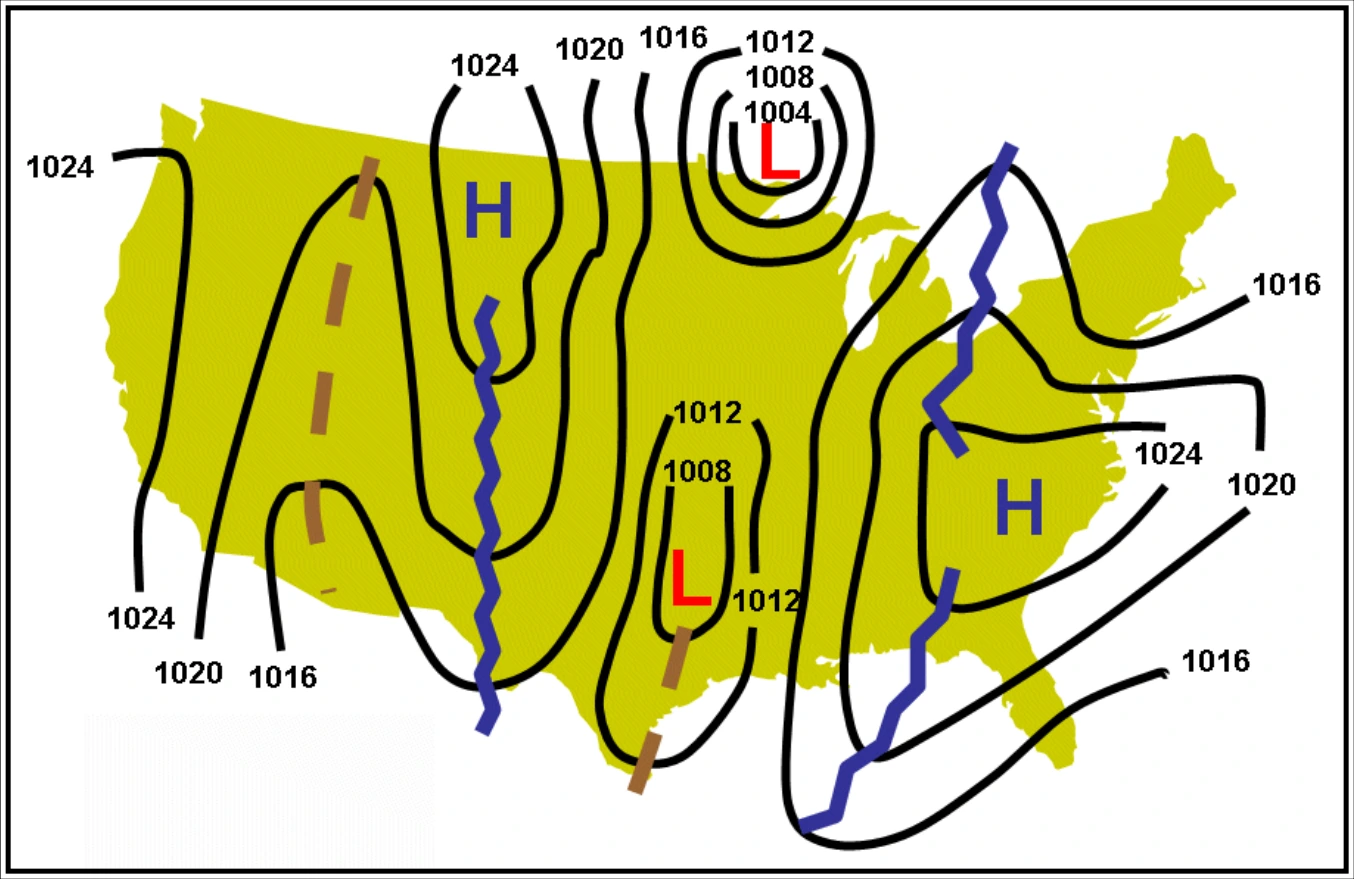
Figure 25-7 is one example of several surface analysis products available on the WPC’s website.
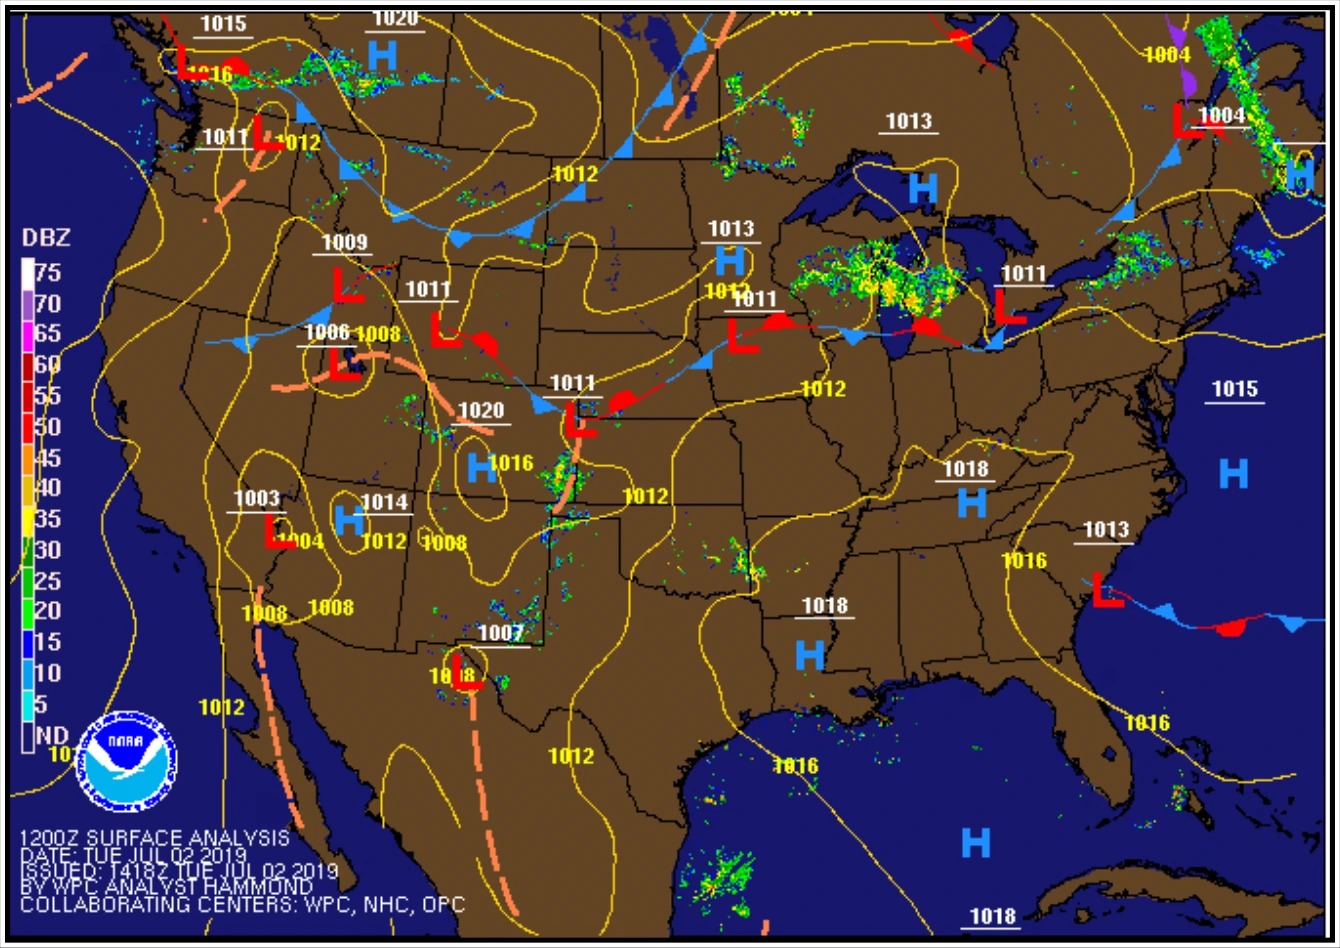
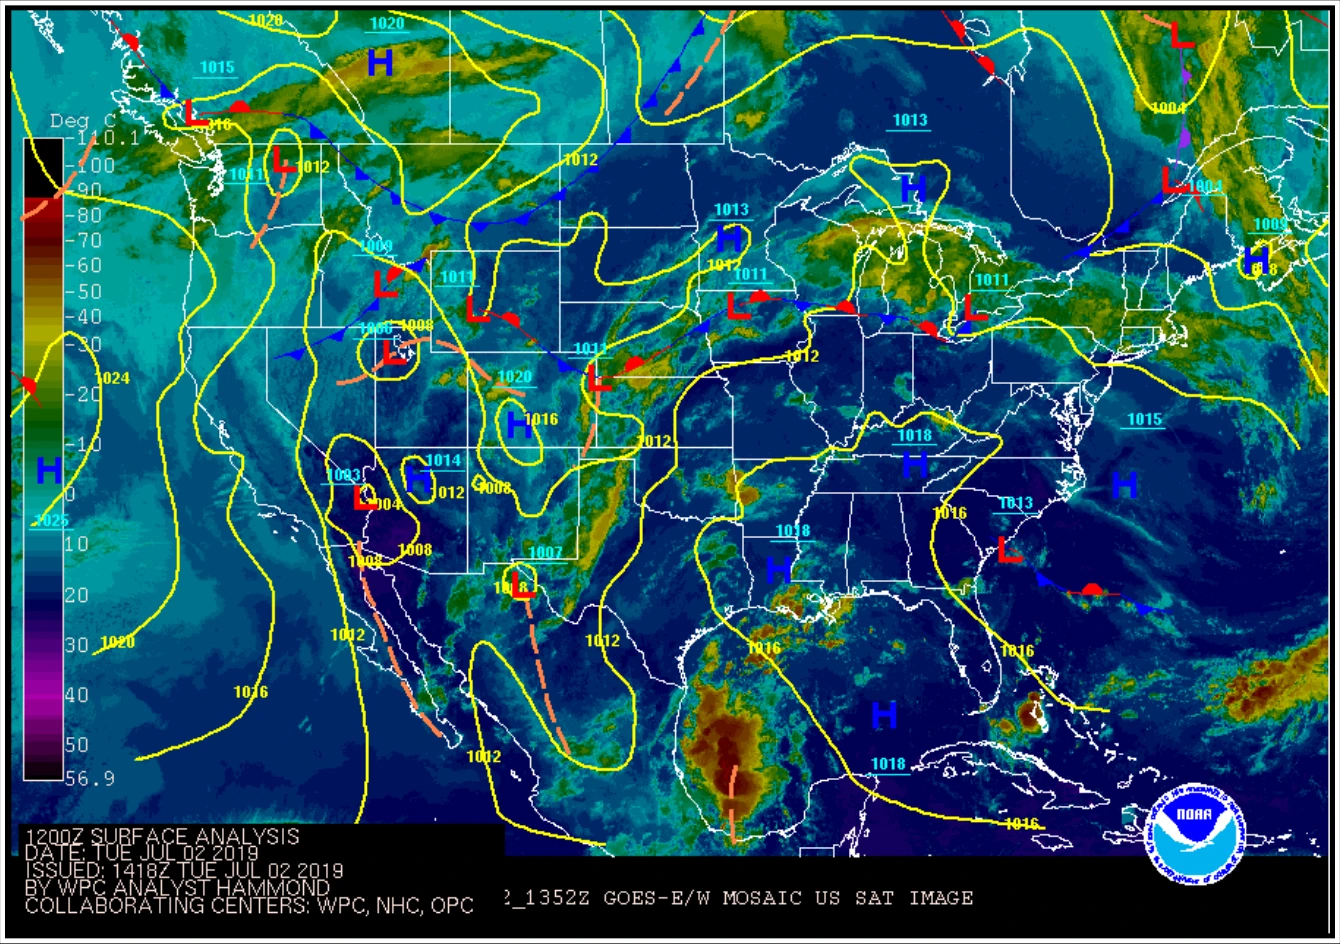
Some of the WPC’s surface analysis charts are combined with radar or satellite imagery (see Figure 25-8 and Figure 25-9) as well as having different background features (e.g., terrain).
25.2.3.1 Issuance
The WPC issues surface analysis charts for North America eight times daily, valid at 00, 03, 06, 09, 12, 15, 18, and 21 UTC.
25.2.3.2 Analysis Symbols
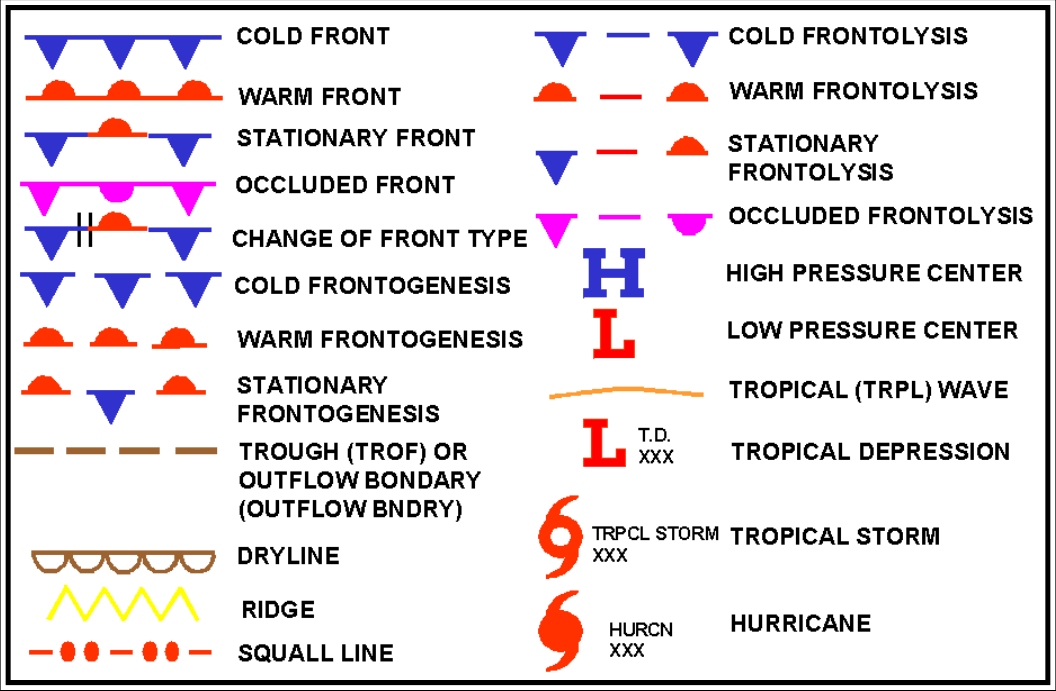
Figure 25-6 shows analysis symbols used on NWS surface analysis charts.
25.2.3.3 Examples
25.2.3.4 Station Plot Models
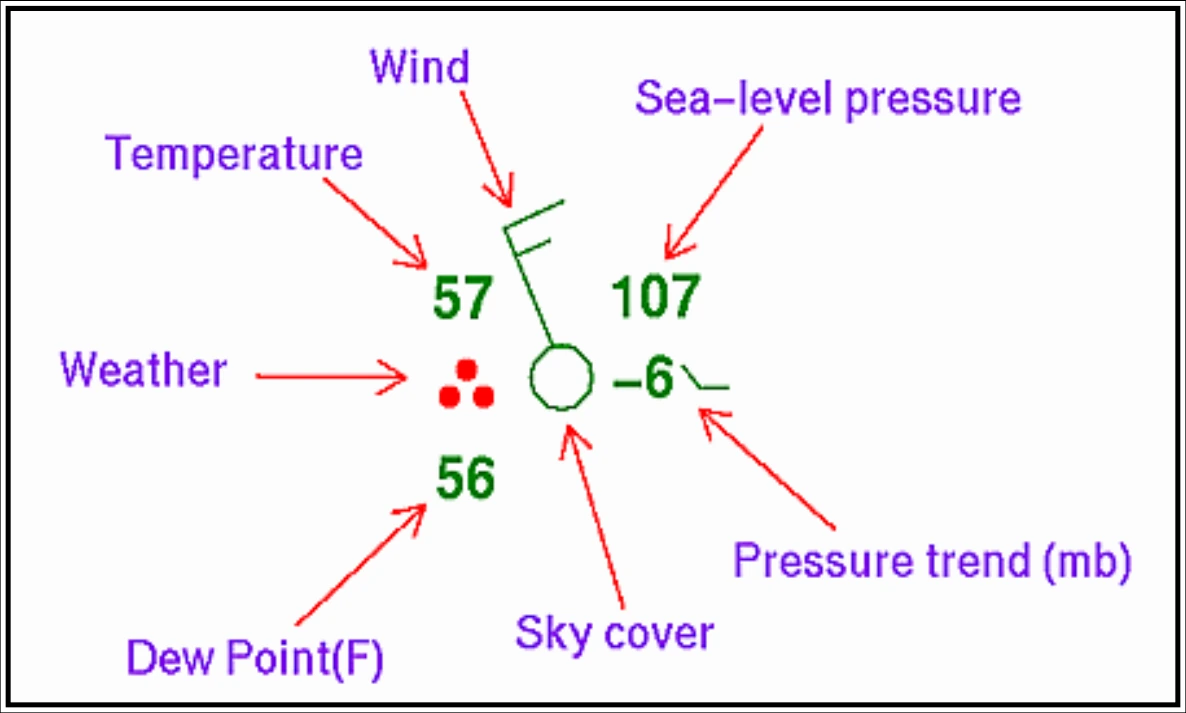
Land, ship, buoy, and C-MAN stations are plotted on the chart to aid in analyzing and interpreting the surface weather features. These plotted observations are referred to as station models. Some stations may not be plotted due to space limitations. However, all reporting stations are used in the analysis.
Figure 25-10 and Figure 25-11 contain the most commonly used station plot models used in surface analysis charts.