Chapter 25
Analysis
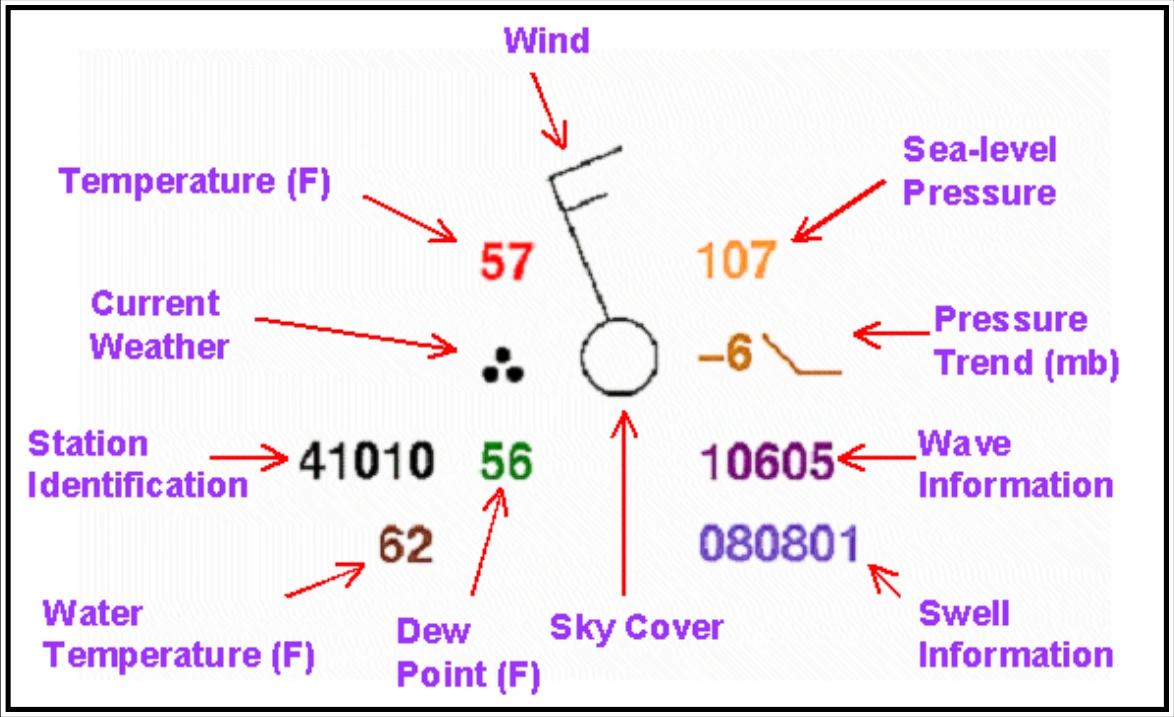
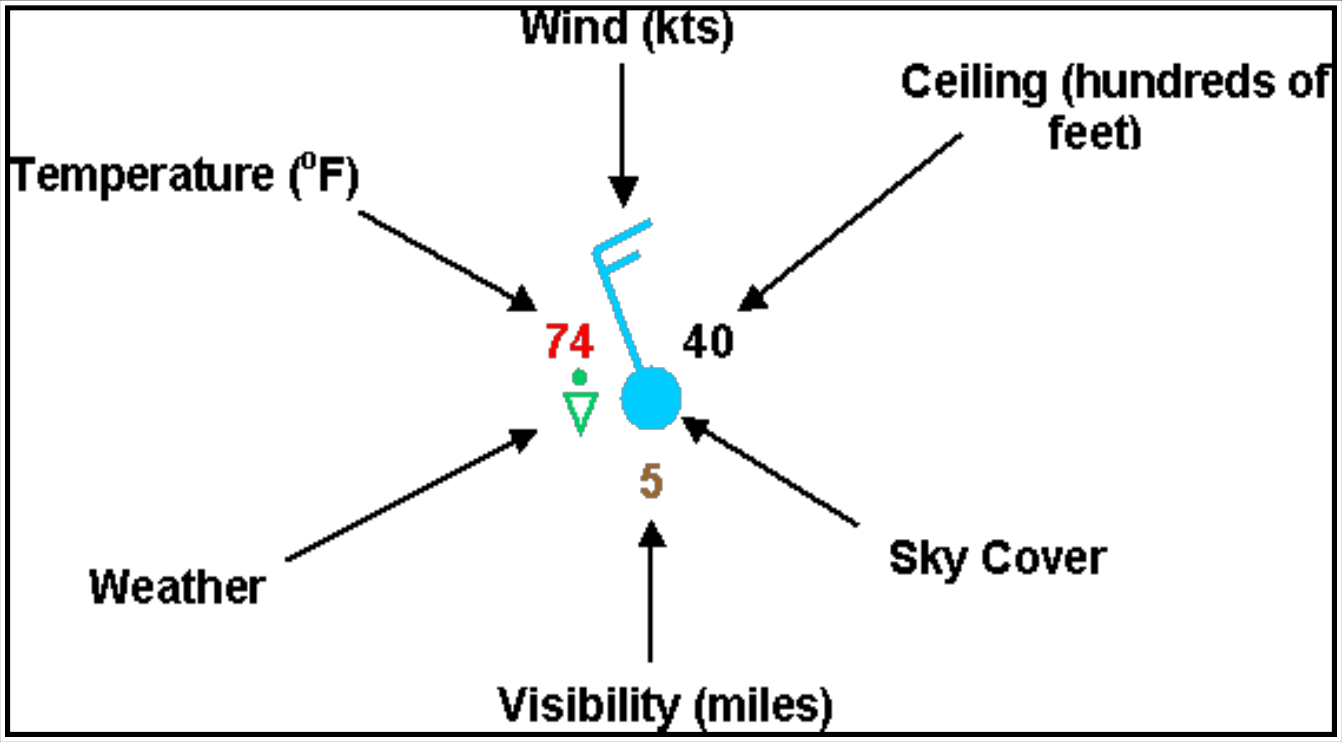
The WPC also produces surface analysis charts specifically for the aviation community. Figure 25-12 contains the station plot model for these charts.
25.2.3.4.1 Station Identifier
The format of the station identifier depends on the observing platform:
- Ship: Typically, four or five characters. If five characters, then the fifth will usually be a digit.
- Buoy: Whether drifting or stationary, a buoy will have a five-digit identifier. The first digit will always be a 4.
- C-MAN: Usually located close to coastal areas. Their identifier will appear like a five-character ship identifier; however, the fourth character will identify off which state the platform is located.
- Land: Land stations will always be three characters, making them easily distinguishable from ship, buoy, and C-MAN observations.
25.2.3.4.2 Temperature
The air temperature is plotted in whole degrees Fahrenheit.
25.2.3.4.3 Dewpoint
The dewpoint temperature is plotted in whole degrees Fahrenheit.
25.2.3.4.4 Weather
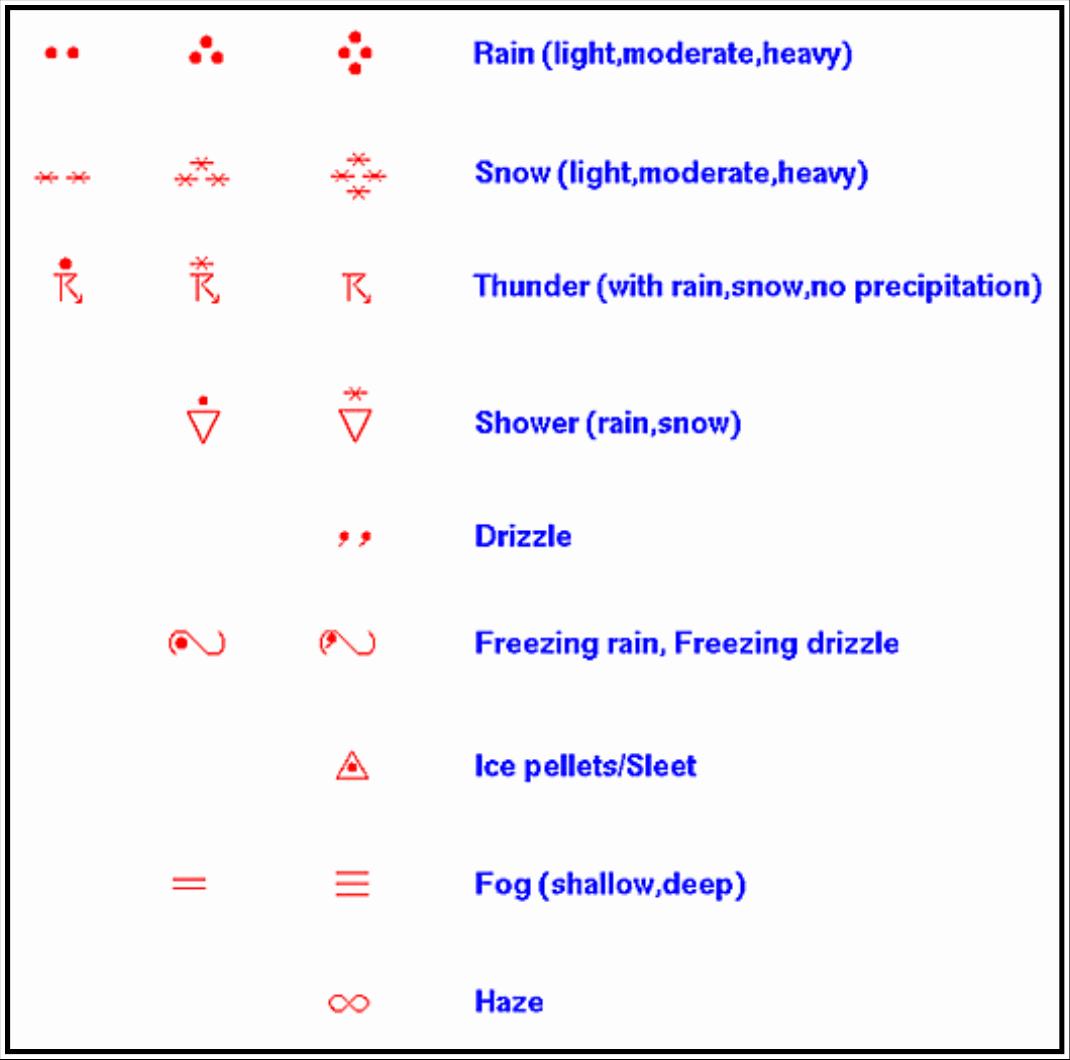
A weather symbol is plotted if, at the time of observation, precipitation is either occurring or a condition exists causing reduced visibility.
Figure 25-13 contains a list of the most common weather symbols.
25.2.3.4.5 Wind
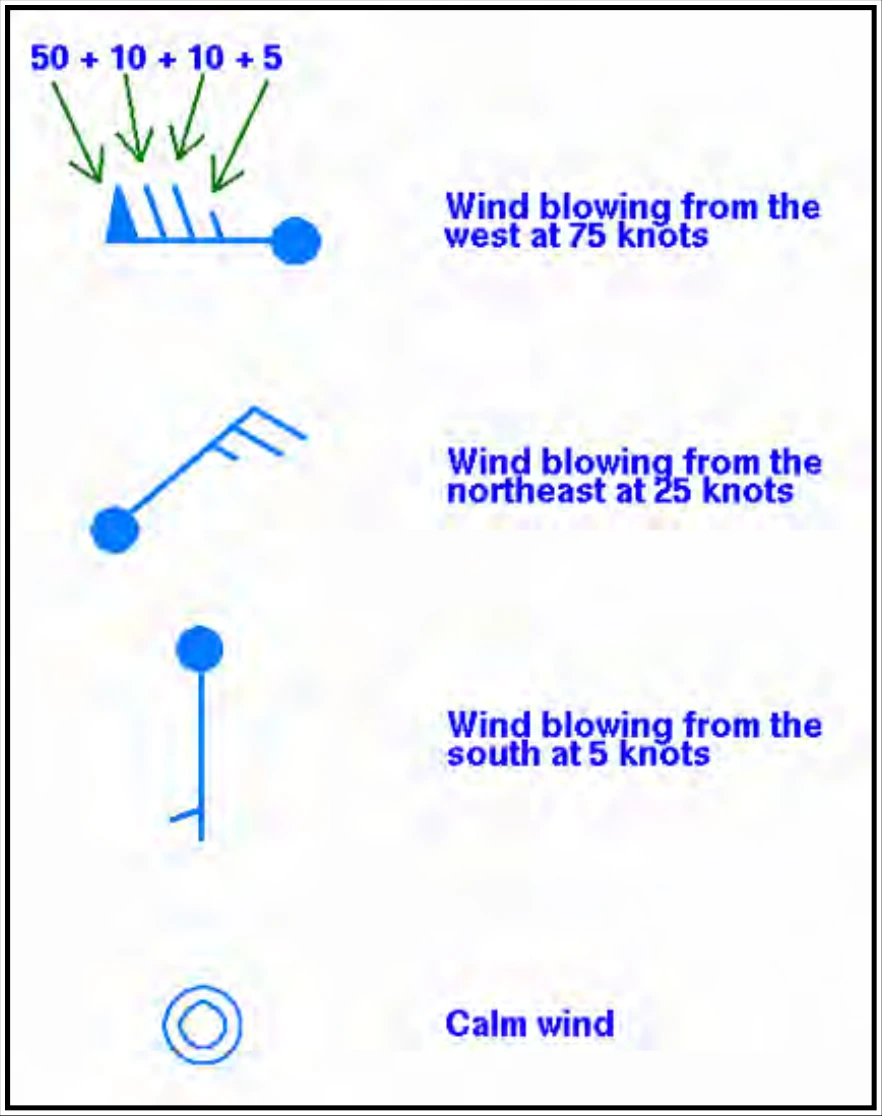
Wind is plotted in increments of 5 kt. The wind direction is referenced to true north and is depicted by a stem (line) pointed in the direction from which the wind is blowing. Wind speed is determined by adding the values of the flags (50 kt), barbs (10 kt), and half-barbs (5 kt) found on the stem.
If the wind is calm at the time of observation, only a single circle over the station is depicted.
Figure 25-14 includes some sample wind symbols.