
Chapter 25
Analysis
25.3.2.1 Issuance
Skew-T diagrams are primarily intended for, and used by, meteorologists as part of their analyses of the atmosphere and formulation of various forecasts.
Skew-T diagrams are available from the NWS NCO. Their “Model Analyses and Guidance” website contains a user’s guide that provides descriptions, details, and examples of the various products, including the skew-T.
25.3.2.2 Format
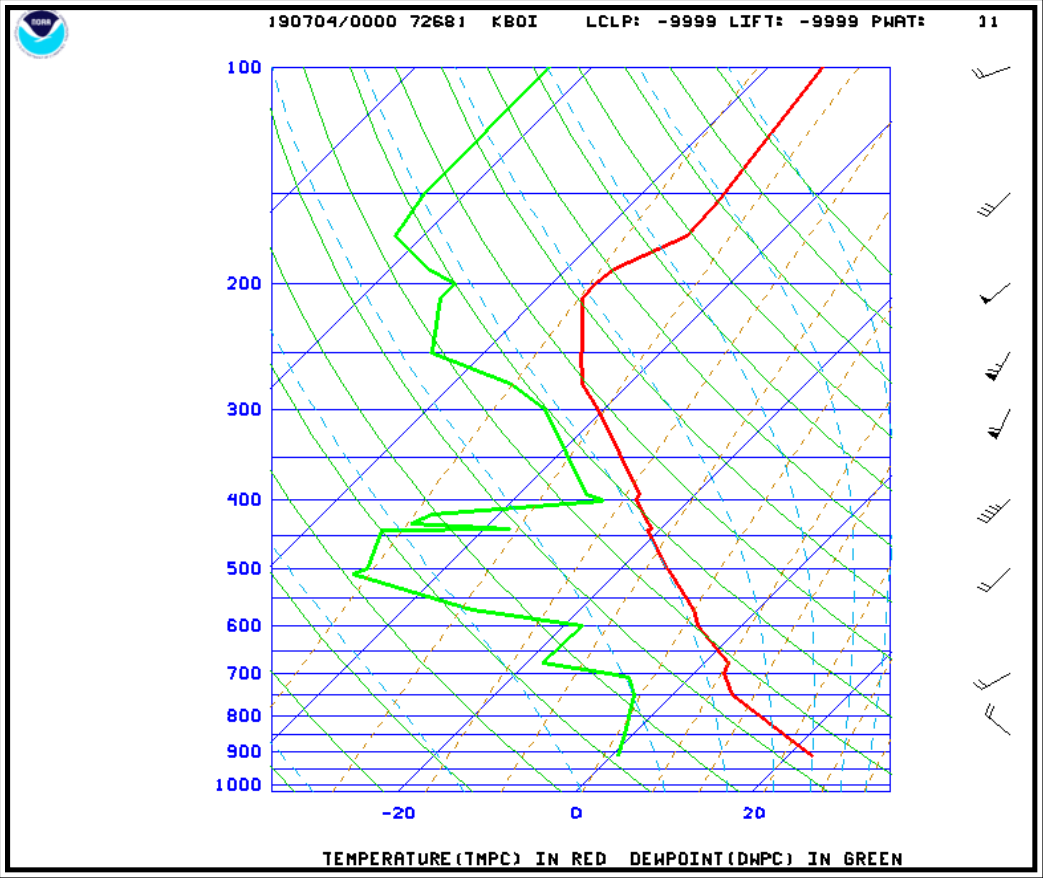
The skew-T diagram provided on the NWS NCO “Model Analyses and Guidance” website uses the following format (other weather providers and websites may have different formats, especially colors):
- Horizontal axis is temperature in degrees Celsius, skewed to the right, labeled -20, 0, and 20 (Celsius).
- Vertical axis is pressure levels in millibars, labeled 1,000 (near sea level) to 100 (approximately 53,000 ft MSL).
- Bold, solid red line represents the temperature profile over the station taken from the radiosonde observation (weather balloon).
- Bold, solid green line represents the dewpoint profile.
- Wind aloft is shown on the far-right side.
25.3.2.3 Examples
Two examples are provided below: a multiple freezing level example (see Figure 25-23) and a cloud top example (see Figure 25-24).
25.3.2.3.1 Multiple Freezing Level Example
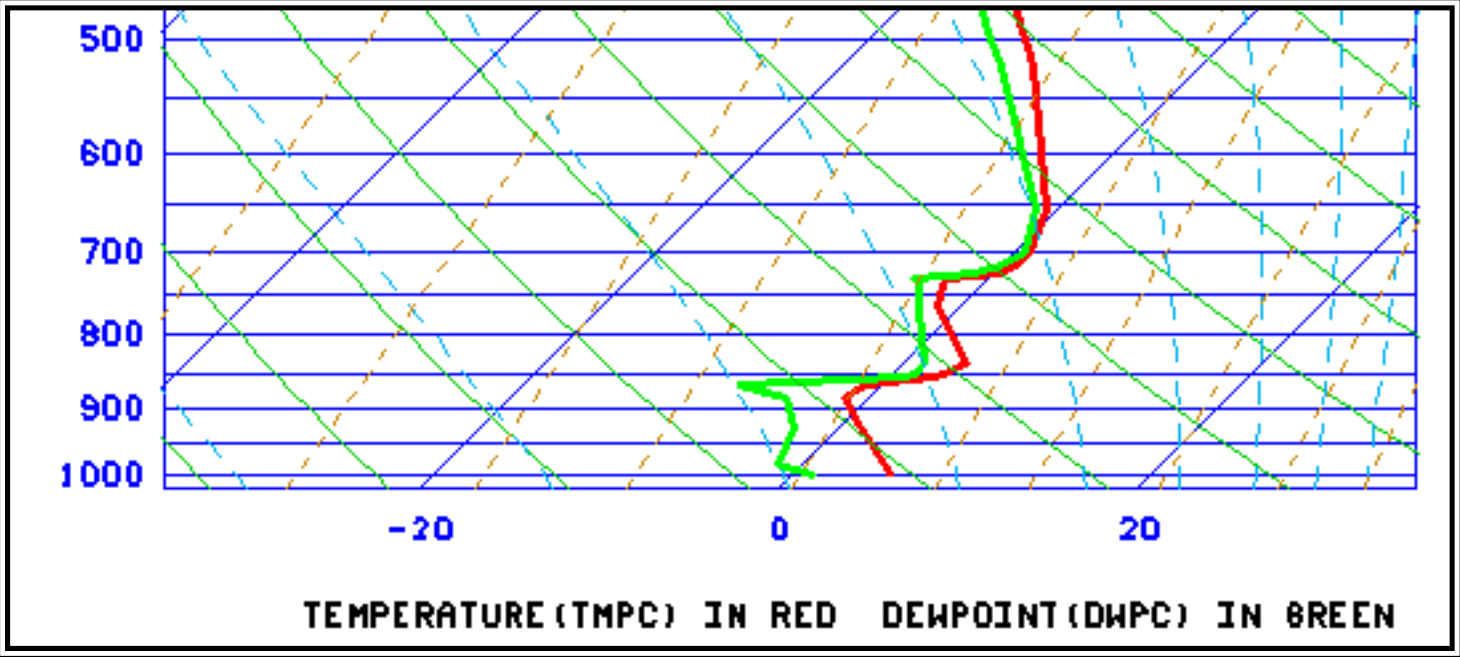
Note how the temperature profile (bold red line) crosses the 0-degree temperature line (also known as an isotherm) five times (near 900 mb, 860 mb, 775 mb, 725 mb, and 675 mb).
25.3.2.3.2 Cloud Top Example
Figure 25-24 is the radiosonde observation from Vandenberg Space Force Base (VSFB), California, for 1200 UTC for a typical coastal stratus cloud.
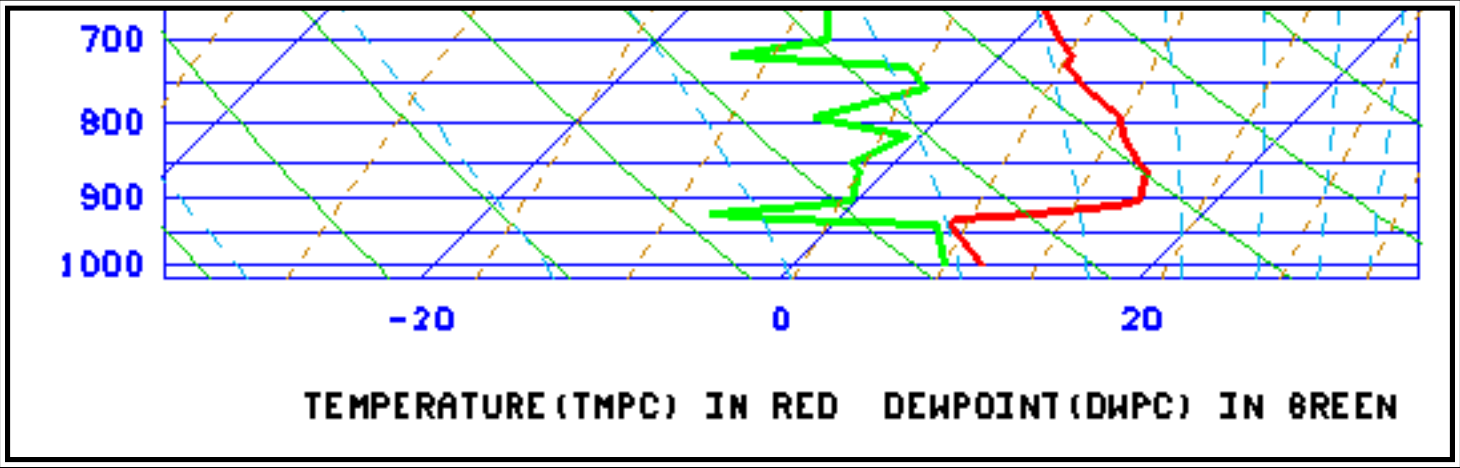
At about 950 mb, the temperature profile (bold red line) and dewpoint profile (bold green line) almost touch each other. This is the profile of a cloud top. The temperature and dewpoint quickly diverge, representing a change from the cool, moist air (and associated stratus cloud) to the dry and warmer air (cloud free) above.
25.4 Freezing Level Analysis
The freezing level is the lowest altitude in the atmosphere over a given location at which the air temperature reaches 0°C. This altitude is also known as the height of the 0°C constant-temperature surface.
The initial analysis is updated hourly. The colors represent the height in hundreds of feet above MSL of the lowest freezing level. Regions with white indicate the surface and the entire depth of the atmosphere are below freezing. Hatched or spotted regions (if present) represent areas where the surface temperature is below freezing with multiple freezing levels aloft.
More information on the freezing level forecast graphics is available on the AWC’s website.