
Chapter 25
Analysis
25.2.5 AAWU Surface Chart
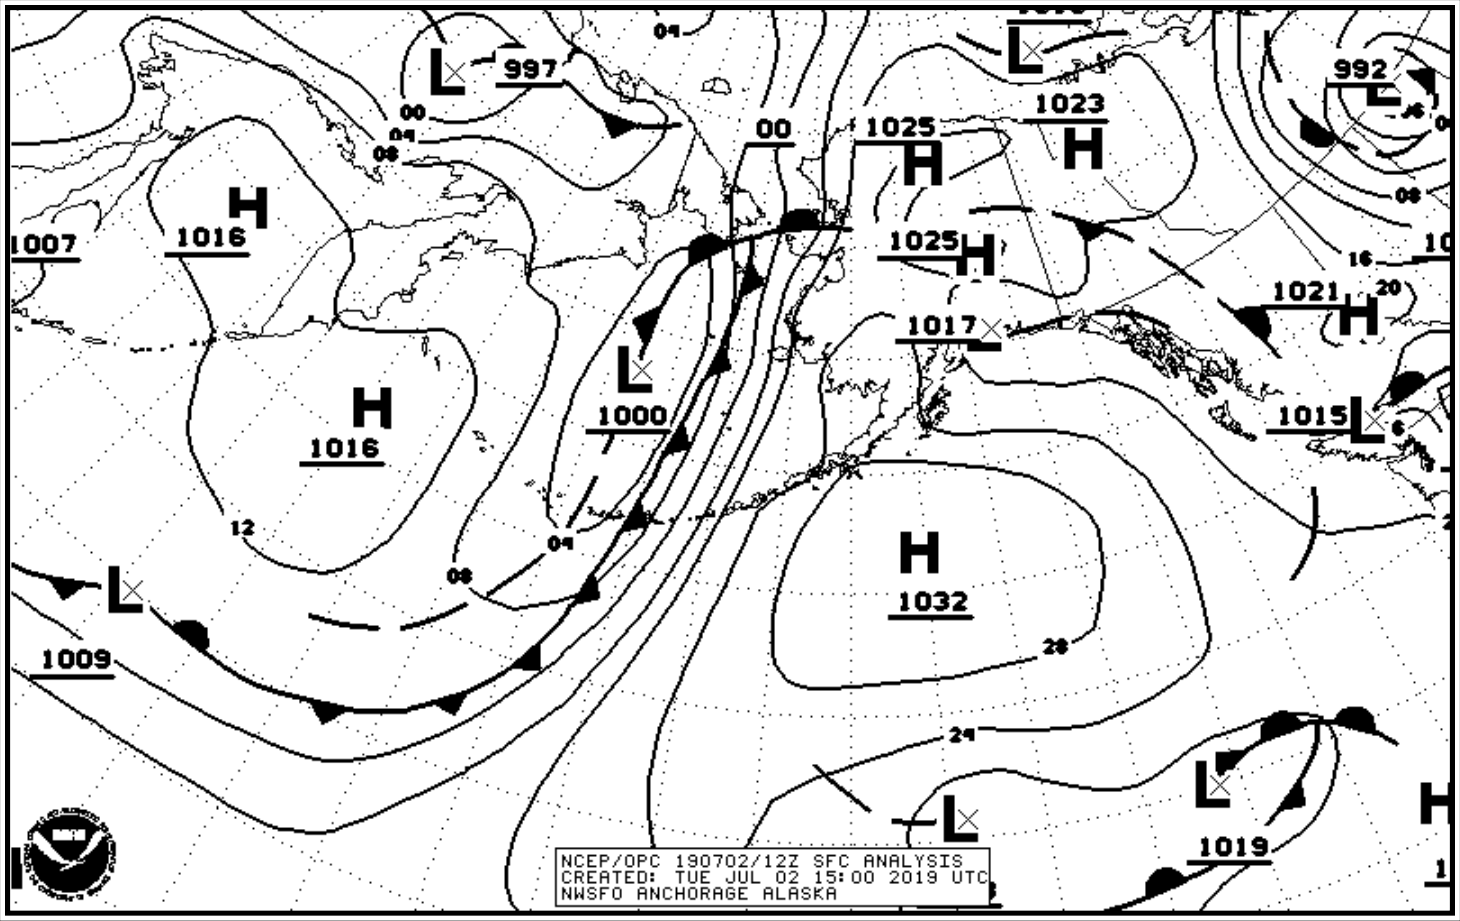
The NWS Unified Surface Analysis Chart covers the Alaska area. The AAWU also provides a fixed area image of the Unified Surface Analysis Chart centered over Alaska (see Figure 25-19). This chart is available from the AAWU’s website.
25.3 Upper Air Analysis
An upper air chart (also known as a constant-pressure chart or an isobaric chart) is a weather map representing conditions on a surface of equal atmospheric pressure. A constant-pressure surface is a surface along which the atmospheric pressure is everywhere equal at a given instant. For instance, the 500 mb constant-pressure surface has a pressure of 500 mb everywhere on it. For example, a 500 mb chart will display conditions at the level of the atmosphere at which the atmospheric pressure is 500 mb.
Constant-pressure charts usually contain plotted data and analyses of the distribution of height of the surface (contours), wind (isotachs), temperature (isotherms), and sometimes humidity (isohumes). The height above sea level at which the pressure is that particular value may vary from one location to another at any given time, and also varies with time at any one location, so it does not represent a surface of constant altitude/height (i.e., the 500 mb level may be at a different height above sea level over Dallas than over New York at a given time and may also be at a different height over Dallas from one day to the next). The height (altitude) of a constant-pressure surface varies primarily due to temperature; these heights can be measured by a rawinsonde.
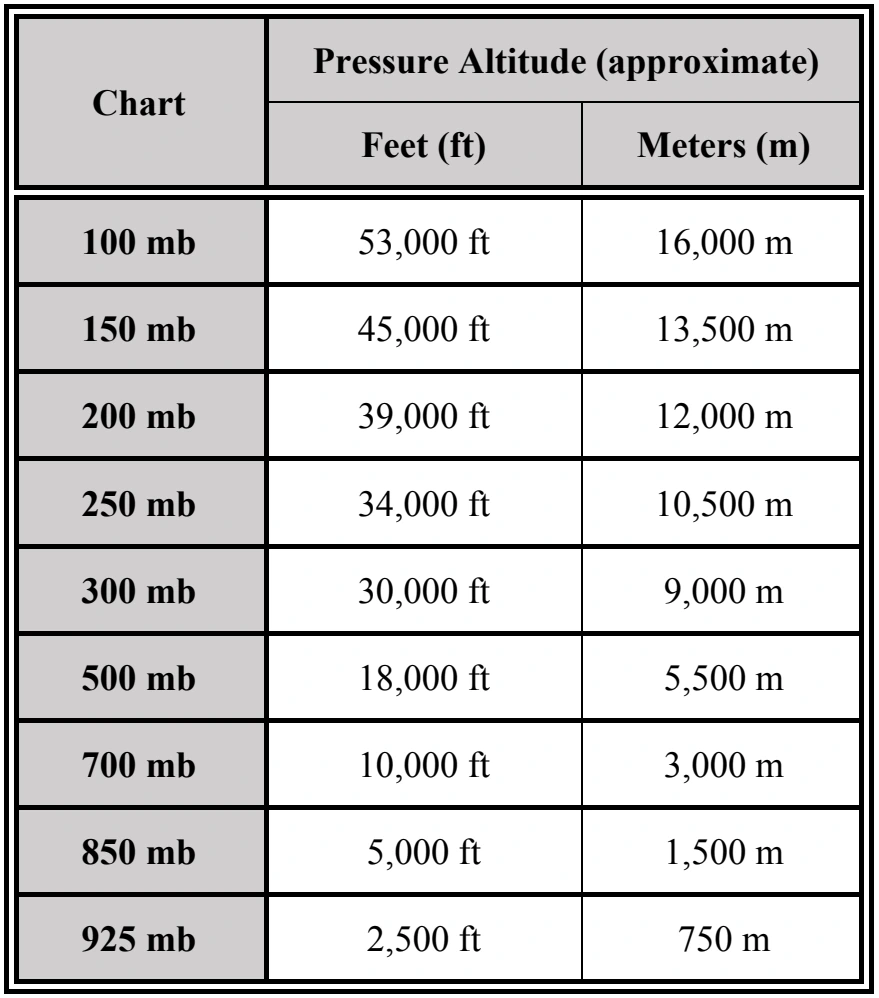
Constant-pressure charts are most commonly known by their pressure value (see Table 25-3 for common constant pressure levels). For example, the 1,000 mb chart (which closely corresponds to the surface chart), the 850 mb chart, 700 mb chart, 500 mb chart, etc.
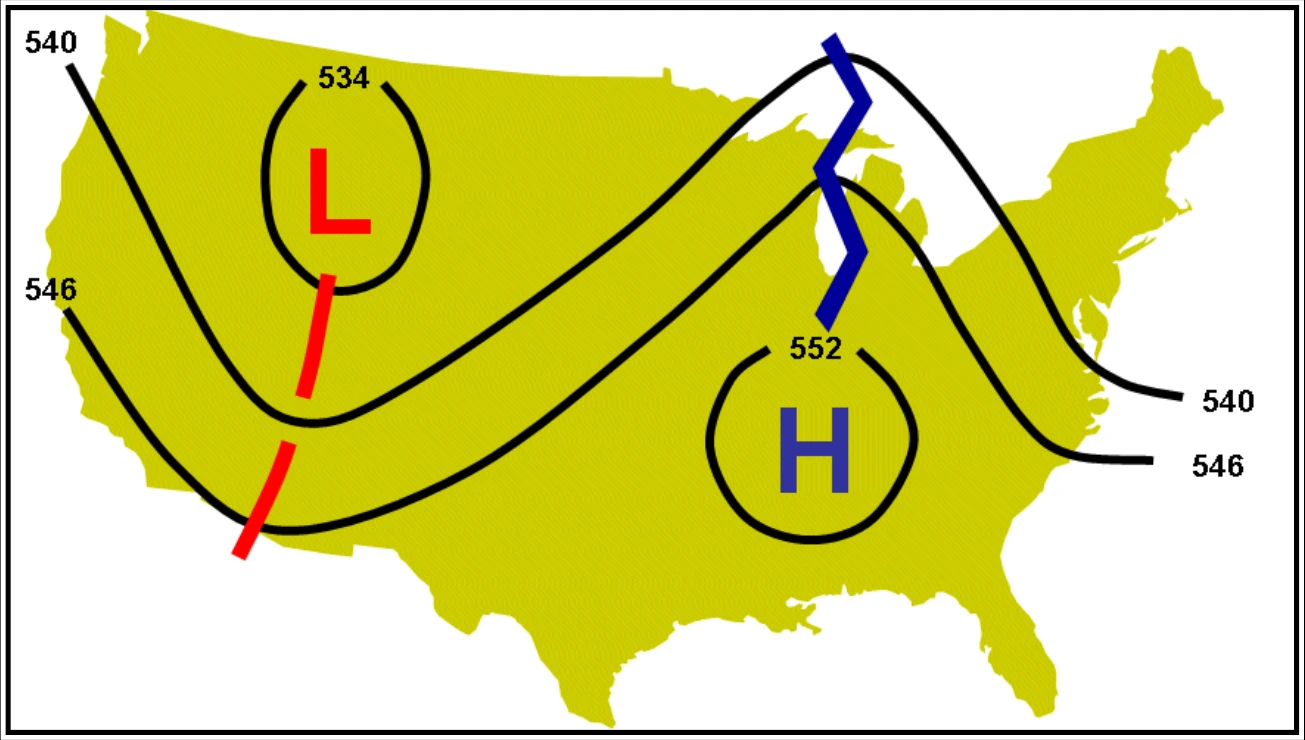
A contour analysis (see Figure 25-20 and Figure 25-21) can reveal highs, ridges, lows, and troughs aloft just as the surface chart shows such systems at the surface. These systems of highs/ridges and lows/troughs are called pressure waves. These pressure waves are similar to waves seen on bodies of water. They have crests (ridges) and valleys (troughs) and are in constant movement.
25.3.1 Issuance
The NWS provides data to produce upper air analysis charts.
25.3.1.1 Examples
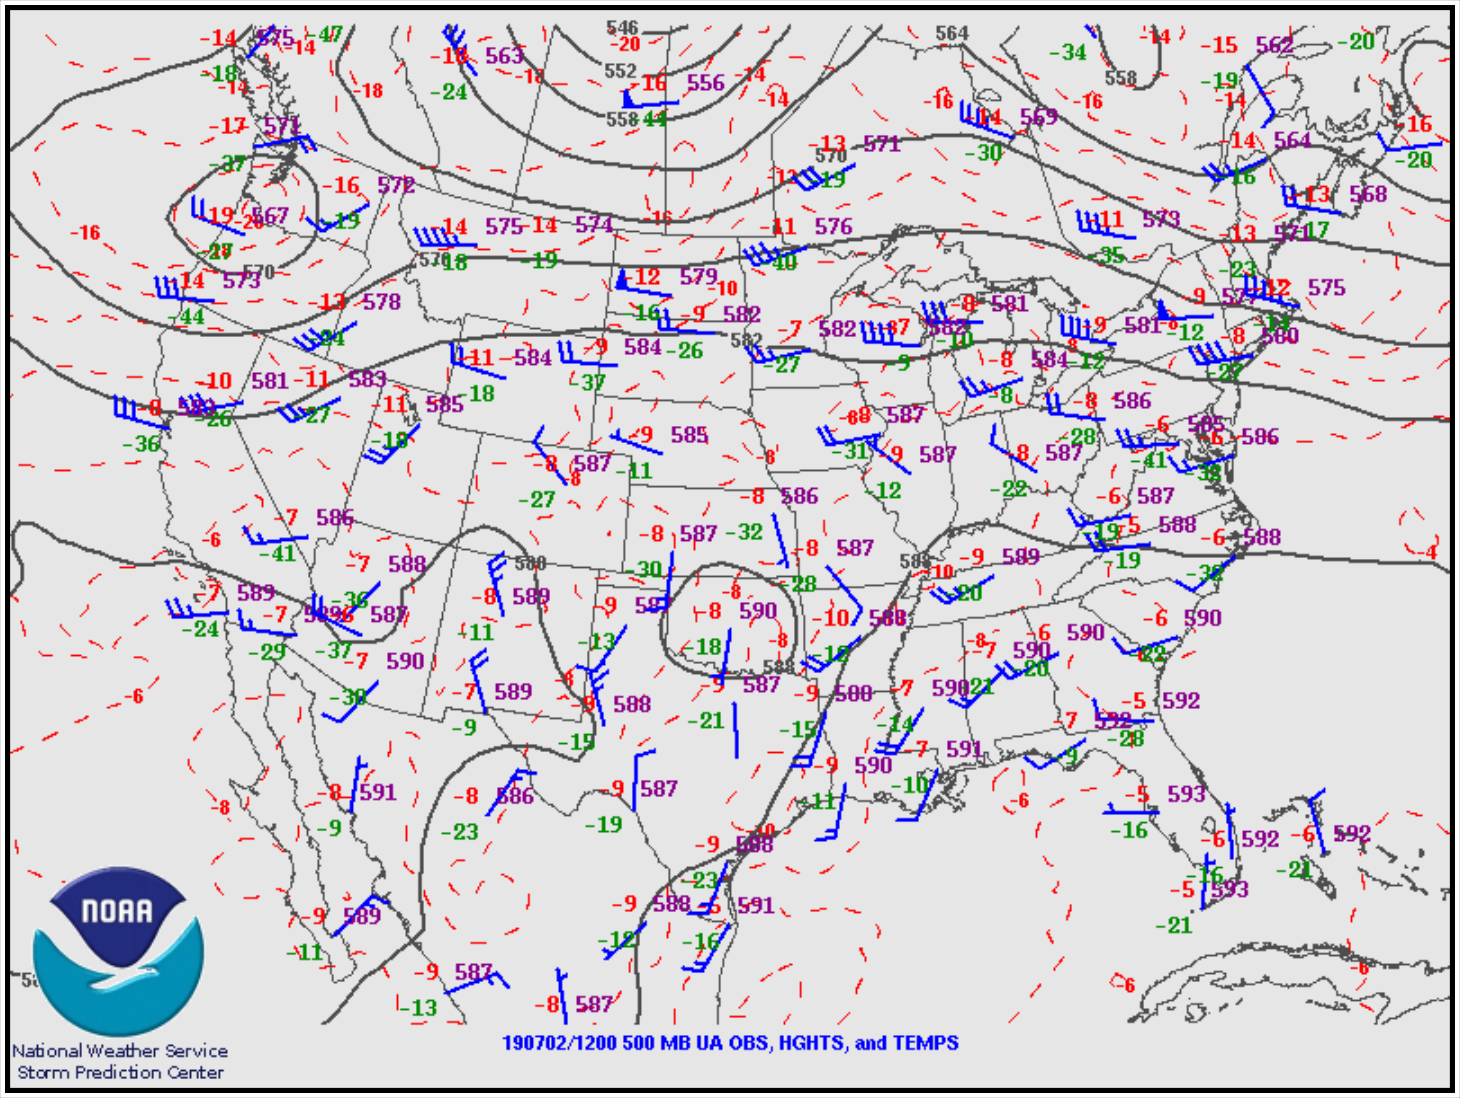
See Figure 25-21 for an example of a 500 mb chart.
Constant pressure level forecasts are used to provide an overview of weather patterns at specified times and pressure altitudes and are the source for wind and temperature aloft forecasts.
Pressure patterns cause and characterize much of the weather. Typically, lows and troughs are associated with clouds and precipitation, while highs and ridges are associated with fair weather, except in winter when valley fog may occur. The location and strength of the jet stream can be viewed at 300 mb, 250 mb, and 200 mb levels.
25.3.2 Radiosonde Observation (Weather Balloon) Analysis
A common means of analyzing radiosonde observations is the skew-T diagram (see Figure 25-22). Skew-T diagrams are primarily intended for, and used by, meteorologists as part of their analyses of the atmosphere. For example, the skew-T diagram can be used to:
- Determine the freezing level (or levels).
- Determine the stability of the atmosphere.
- Determine the potential for severe weather.
- Determine the height and depth of inversions.
- Infer cloud bases, tops, and layers.
- Determine soaring conditions.