
Chapter 25
Analysis
090703:
- 09: The swell direction is from 90° (i.e., it is coming from due east).
- 07: The period of the swell is seven seconds.
- 03: The height of the swell is three half m.
271006:
- 27: The swell direction is from 270° (due west).
- 10: The period is 10 seconds.
- 06: The height of the swell is six half m.
25.2.3.4.13 Wave Information
Period and height of waves are represented by a five-digit code. The first digit is always 1. The second and third digits describe the wave period (in seconds), and the final two digits give the wave height (in half meters).
10603:
- 1: A group identifier. The first digit will always be 1.
- 06: The wave period is six seconds.
- 03: The wave height is three half m.
10515:
- 1: A group identifier.
- 05: The wave period is five seconds.
- 15: The wave height is 15 half m.
In some charts by the OPC, only the wave height (in feet) is plotted.
25.2.4 Unified Surface Analysis Chart
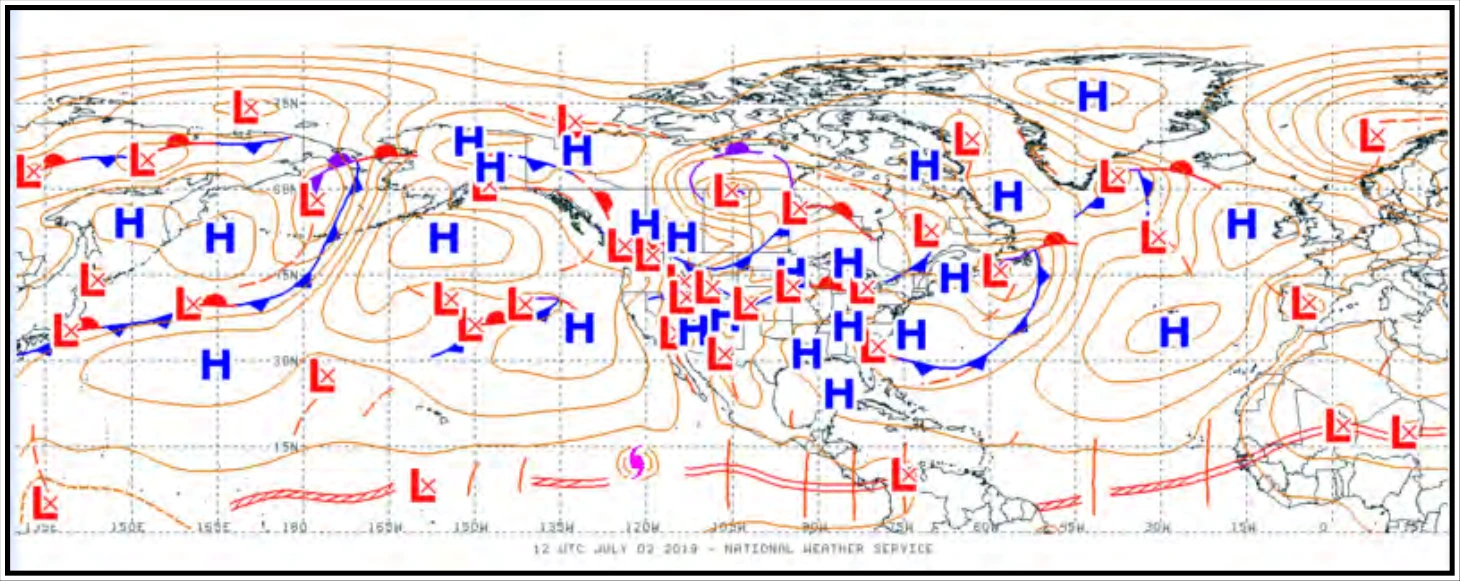
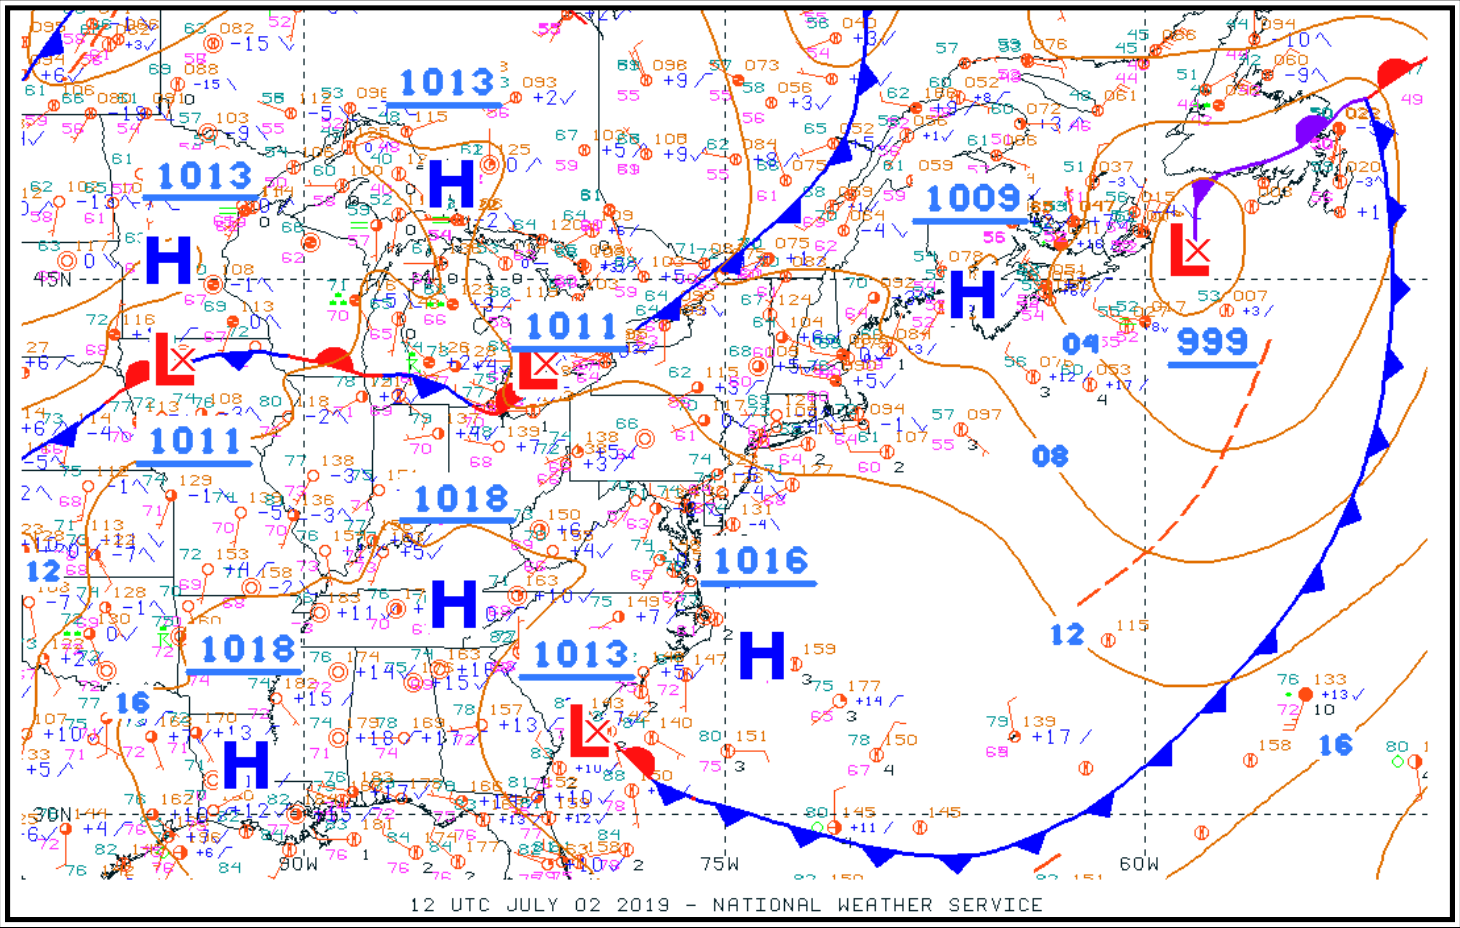
The NWS Unified Surface Analysis Chart is a surface analysis product produced collectively and collaboratively by the NWS WPC, the OPC, the NHC, and WFO Honolulu. The chart contains an analysis of isobars, pressure systems, and fronts.
This chart is available on the OPC’s website. Users can zoom in by clicking an area on the map to enlarge (see Figure 25-17 and Figure 25-18) and show station plot models (see Section 25.2.3.4).
25.2.4.1 Issuance
The Unified Surface Analysis Chart is issued four times daily for valid times 00, 06, 12, and 18 UTC.
25.2.4.2 Analysis Symbols
Unified Surface Analysis Charts use the symbols shown in Figure 25-6.