
Chapter 8
Atmospheric Pressure and Altimetry
The next few sections will examine some factors that influence pressure.
8.2.4 Pressure Variation
Atmospheric pressure varies with altitude and the temperature of the air, as well as with other minor influences, such as water vapor.
8.2.4.1 Pressure Changes with Altitude
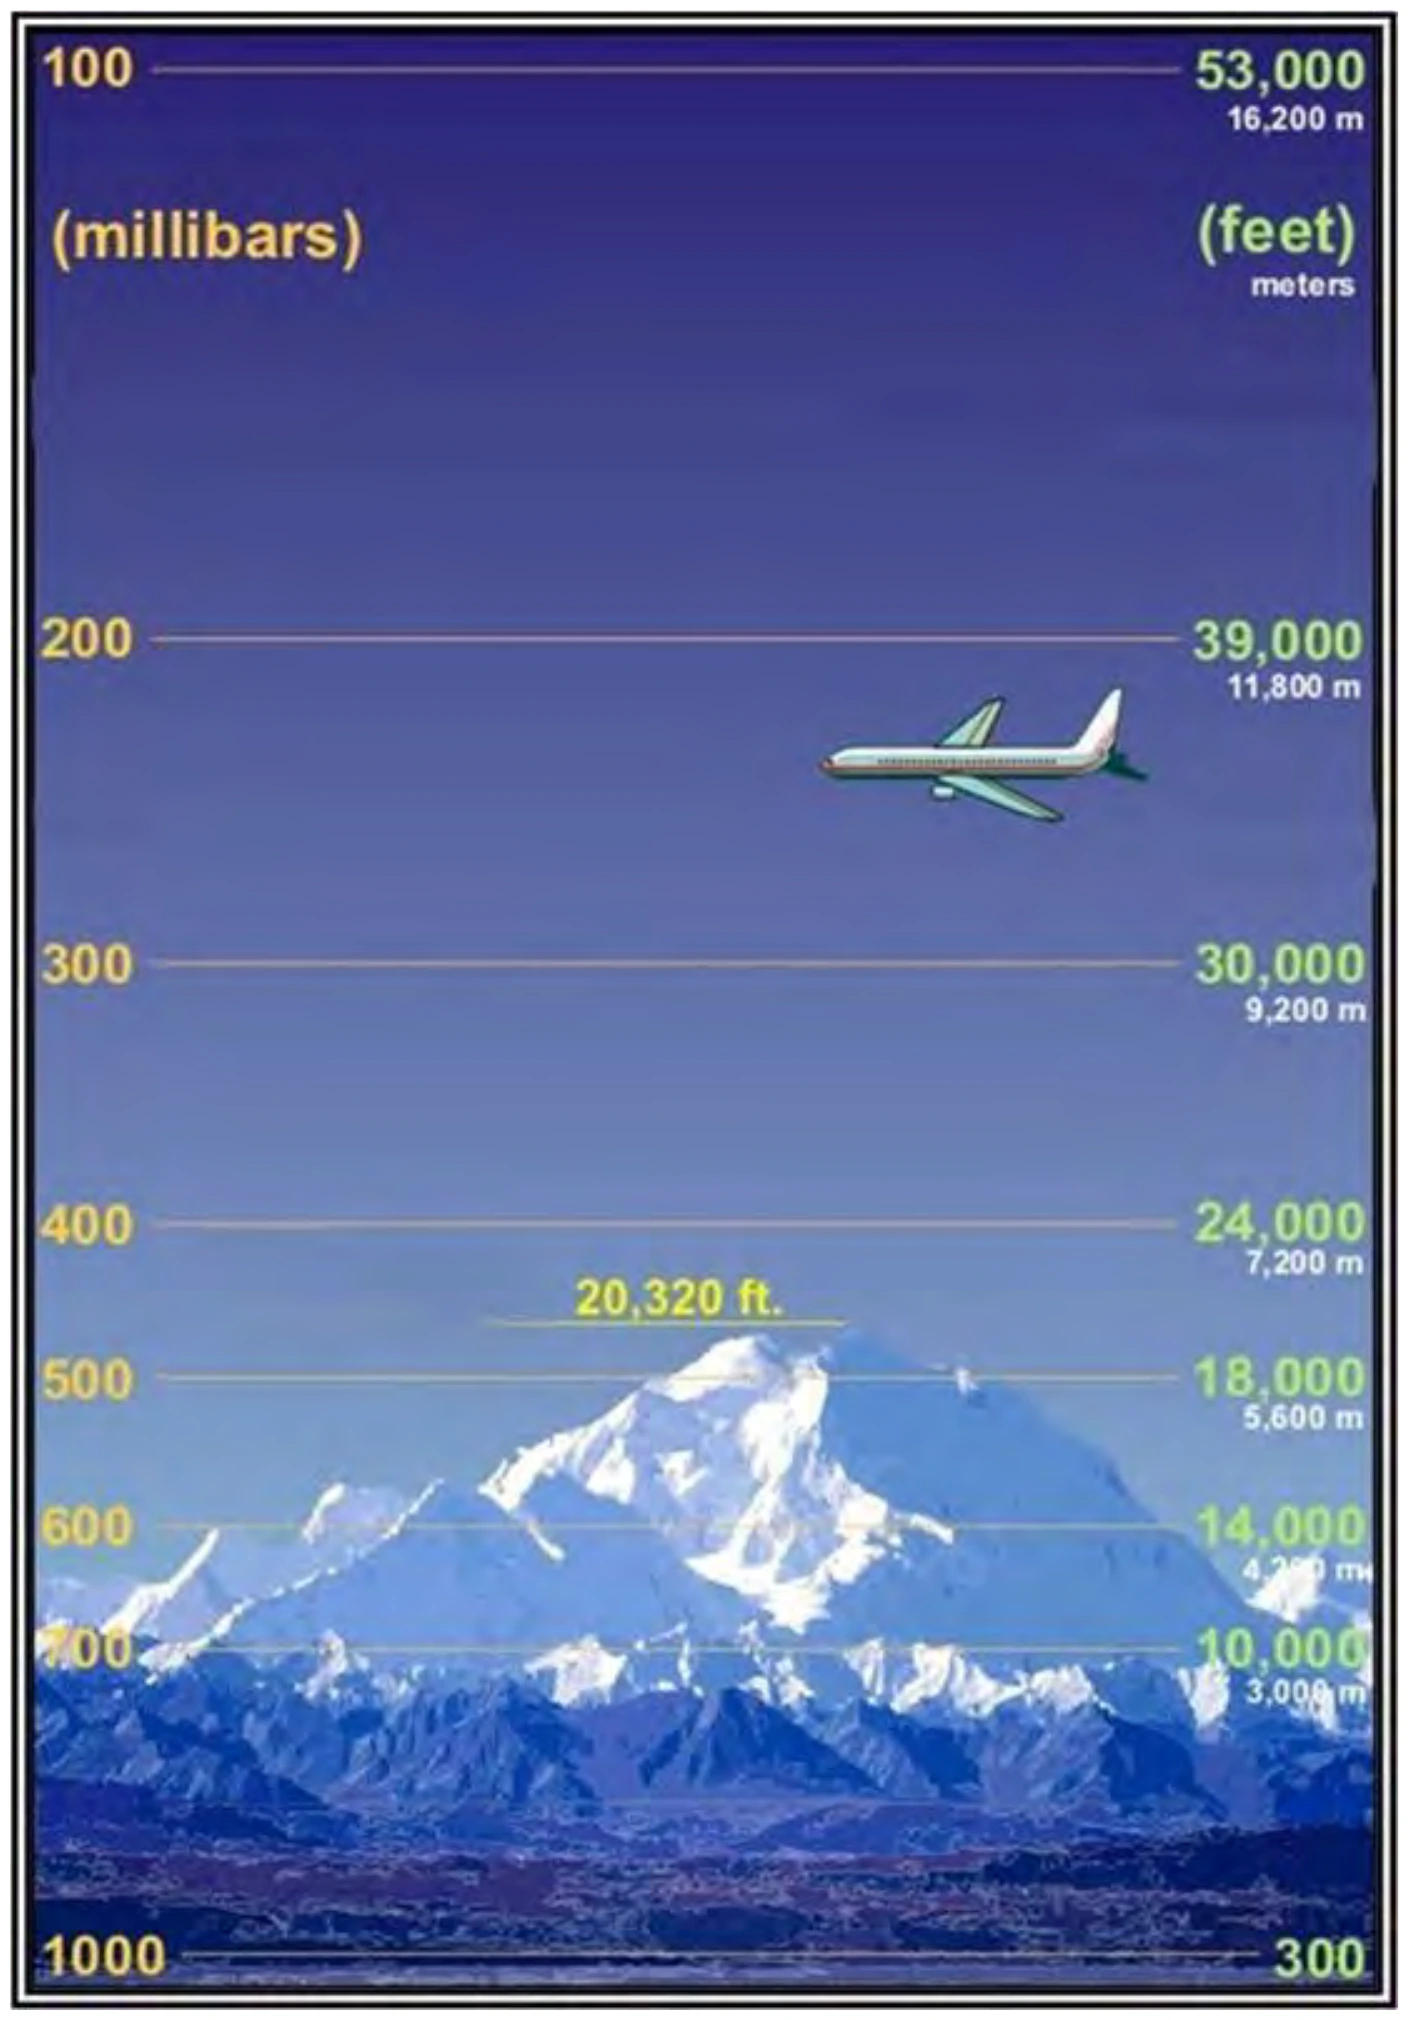
As a person moves upward through the atmosphere, the weight of the air above the person decreases. If a person carries a barometer, then they can measure a decrease in pressure as the weight of the air above them decreases. Figure 8-4 shows the pressure decrease with height in the standard atmosphere.
The standard altitudes in Figure 8-4 are based on standard temperatures. In the real atmosphere, temperatures are seldom standard, so temperature’s effects on pressure will be explored in the following section.
8.2.4.2 Temperature’s Effects on Pressure
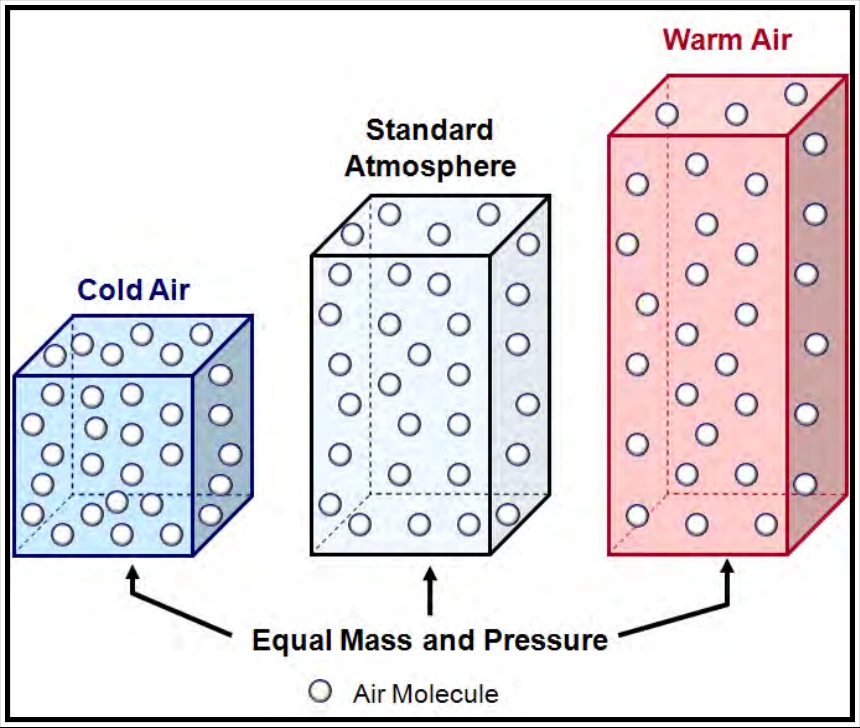
Like most substances, air expands as it becomes warmer and contracts as it cools. Figure 8-5 shows three columns of air: one colder than standard, one with standard temperature, and one warmer than standard. Pressure is equal at the bottom and top of each column. Vertical expansion of the warm column has made it taller than the column at standard temperature. Contraction of the cold column has made it shorter than the standard column. Since the total pressure decrease is the same in each column, the rate of decrease of pressure with height in warm air is less than standard, while the rate of decrease in pressure with height in cold air is greater than standard.
8.2.5 Sea Level Pressure
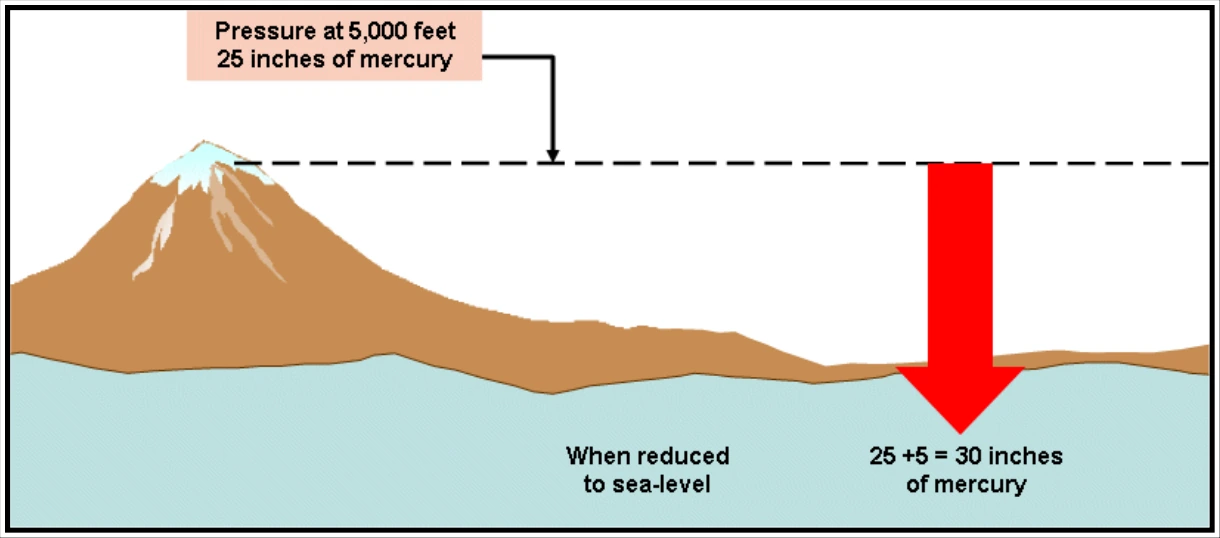
Since pressure varies greatly with altitude, people cannot readily compare station pressures between stations at different altitudes. To make them comparable, they are adjusted to some common level. Mean sea level (MSL) is the most useful common reference. In Figure 8-6, pressure measured at a station at a 5,000-ft elevation is 25 inHg; pressure increases about 1 inHg for each 1,000 ft, or a total of 5 inHg. Sea level pressure is approximately 25 + 5, or 30 inHg.
Sea level pressure is typically displayed on surface weather charts. Pressure continually changes across the Earth, so a sequence of surface charts must be viewed to follow these changing pressures.
8.3 Density
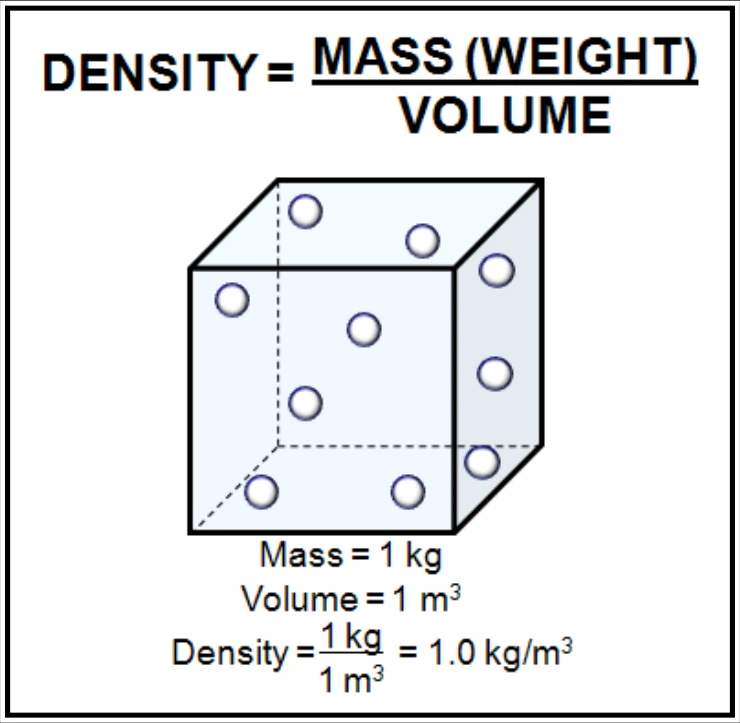
Density is the ratio of any quantity to the volume or area it occupies. Atmospheric density is defined as ratio of the mass (or weight) of the air to the volume occupied by it, usually expressed in kilograms per cubic meter (see Figure 8-7).
8.3.1 Volume’s Effects on Density
The density of an air parcel varies inversely with its volume. Assuming equal mass, an air parcel with a higher density has a smaller volume than an air parcel with a lower density (see Figure 8-8).
The shorter parcel (i.e., the parcel with the smaller volume) has a higher density than the taller parcel, which contains the larger volume. This is due to the fact that the air molecules within the shorter parcel must be compressed within the smaller volume.