
Chapter 25
Analysis
Ceiling is plotted in hundreds of feet AGL.
25.2.3.4.7 Visibility
Surface visibility is plotted in whole statute miles.
25.2.3.4.8 Pressure
Sea level pressure is plotted in tenths of millibars, with the first two digits (generally 10 or 9) omitted. For reference, 1,013 mb is equivalent to 29.92 inHg. Below are some sample conversions between plotted and complete sea level pressure values.
410 1,041.0 mb
103 1,010.3 mb
987 998.7 mb
872 987.2 mb
25.2.3.4.9 Pressure Trend
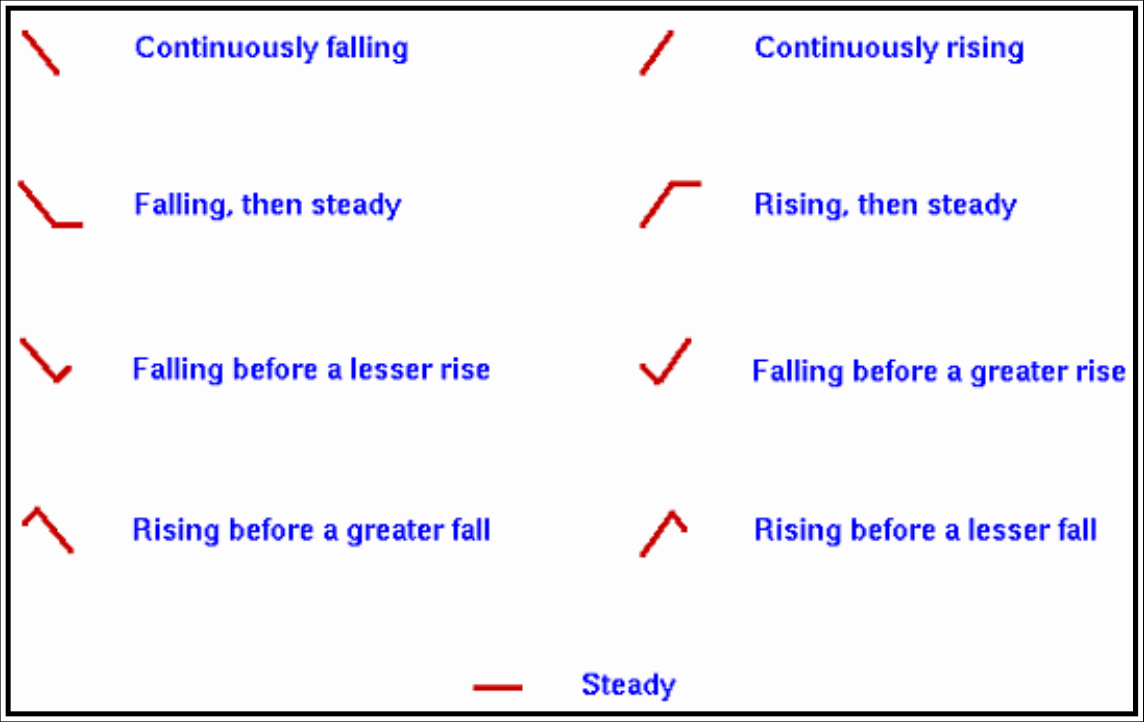
The pressure trend has two components, a number and a symbol, to indicate how the sea level pressure has changed during the past three hours. The number provides the three-hour change in tenths of millibars, while the symbol provides a graphic illustration of how this change occurred.
Figure 25-15 contains the meanings of the pressure trend symbols.
25.2.3.4.10 Sky Cover
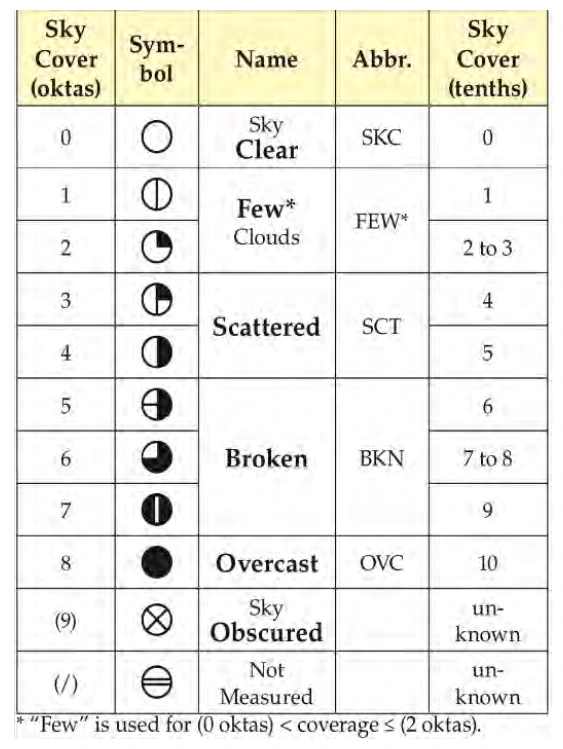
The approximate amount of sky cover can be determined by the circle at the center of the station plot. The amount that the circle is filled reflects the amount of sky covered by clouds. Figure 25-16 contains the common cloud cover depictions.
25.2.3.4.11 Water Temperature
Water temperature is plotted in whole degrees Fahrenheit.
25.2.3.4.12 Swell Information
Swell direction, period, and height are represented in the surface observations by a six-digit code. The first two digits represent the swell direction, the middle digits describe the swell period (in seconds), and the last two digits are the swell’s height (in half meters).