
Chapter 27
Forecasts
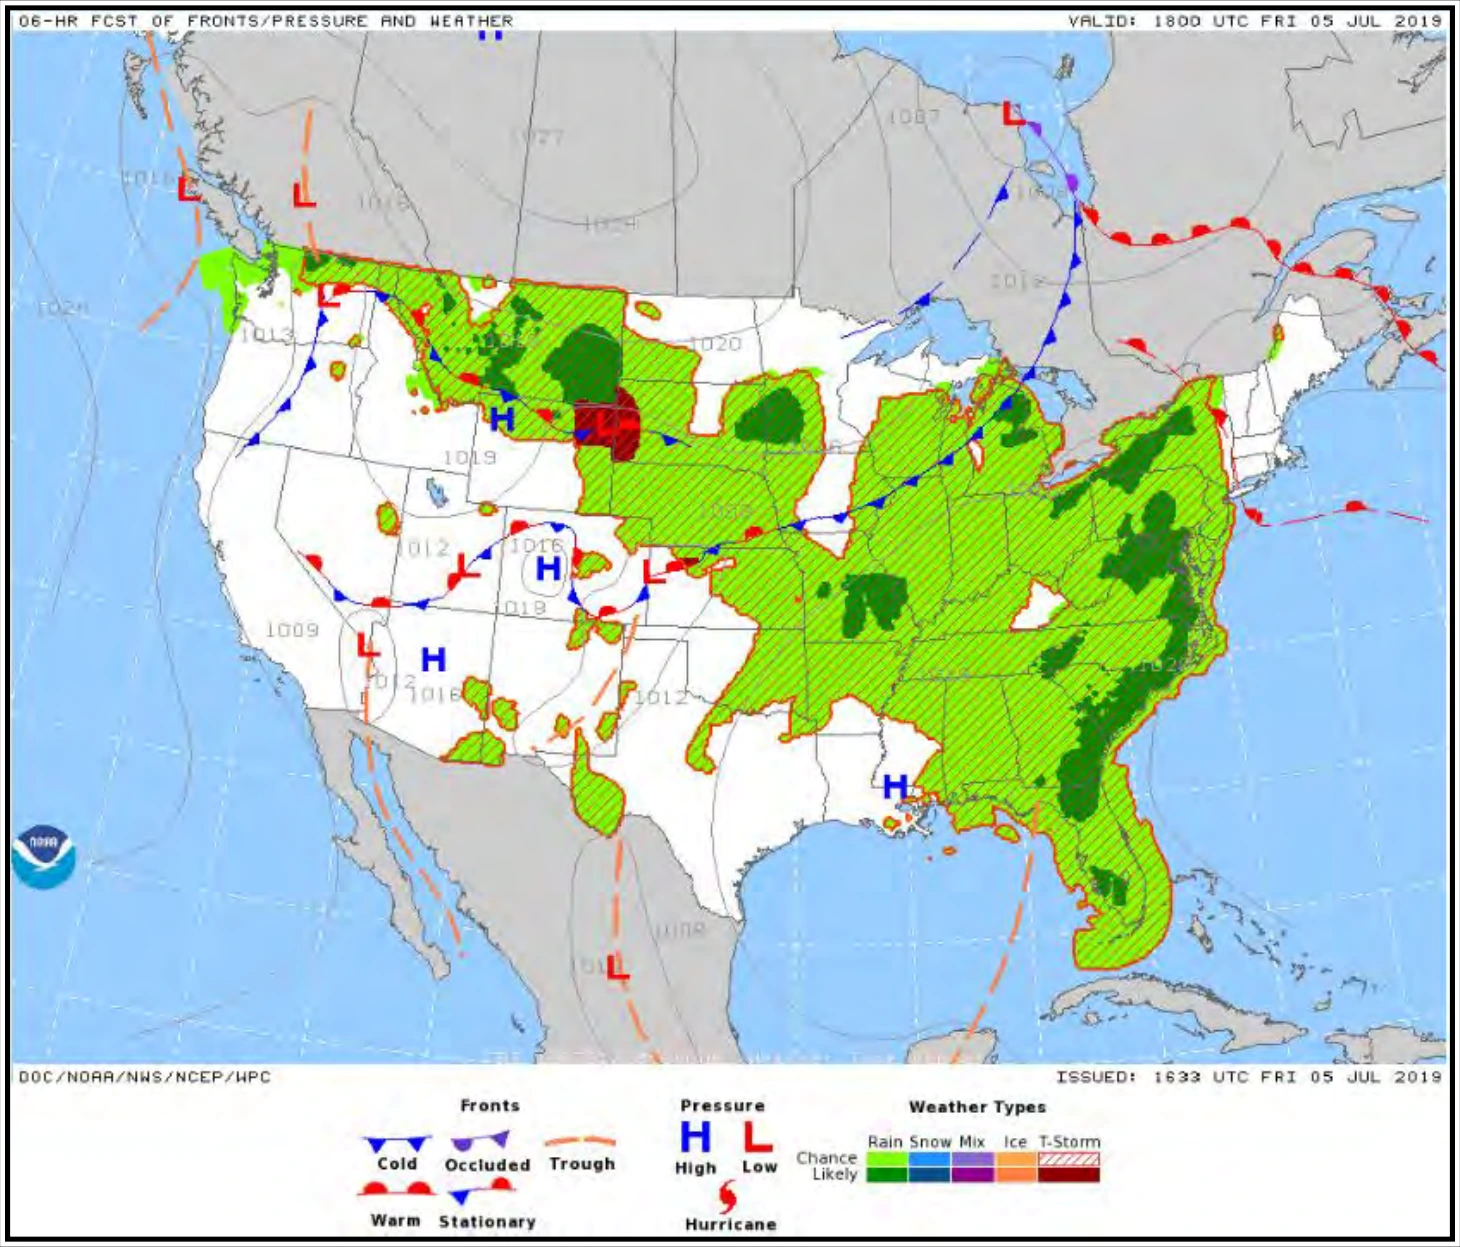
The NWS WPC provides Short-Range Surface Prog Charts (see Figure 27-24) of surface pressure systems, fronts, and precipitation for a multiday period. The forecast area covers the CONUS and coastal waters. The forecasted conditions are divided into selected forecast valid time periods. Each chart depicts a “snapshot” of weather elements expected at the specified valid time.
The Short-Range Surface Prog Charts combine WPC forecasts of fronts, isobars, and high/low pressure systems with the NWS’ National Digital Forecast Database (NDFD) digital forecasts from the NWS WFO. The Short-Range Surface Prog Forecasts are issued by the WPC in College Park, MD.
27.10.1 Content
27.10.1.1 Precipitation
The Short-Range Surface Prog Forecast provides precipitation forecasts in the following depiction:
- NDFD Rain (Chance—light green): There is a 25 to less than 55 percent probability of measurable rain (≥0.01 in) at the valid time.
- NDFD Rain (Likely—dark green): There is a greater than or equal to 55 percent probability for measurable rain (≥0.01 in) at the valid time.
- NDFD Snow (Chance—light blue): There is a 25 to less than 55 percent probability of measurable snowfall (≥0.01 in liquid equivalent) at the valid time.
- NDFD Snow (Likely—dark blue): There is a greater than or equal to 55 percent probability of measurable snow (≥0.01 in liquid equivalent) at the valid time.
- NDFD Mix (Chance—light purple): There is a 25 to less than 55 percent probability of measurable mixed precipitation (≥0.01 in liquid equivalent) at the valid time. “Mix” can refer to precipitation where a combination of rain and snow, rain and sleet, or snow and sleet are forecast.
- NDFD Mix (Likely—dark purple): There is a greater than or equal to 55 percent probability of measurable mixed precipitation (≥0.01 in liquid equivalent) at the valid time. “Mix” can refer to precipitation where a combination of rain and snow, rain and sleet, or snow and sleet are forecast.
- NDFD Ice (Chance—light brown): There is a 25 to less than 55 percent probability of measurable freezing rain (≥0.01 in) at the valid time.
- NDFD Ice (Likely—brown): There is a greater than or equal to 55 percent probability of measurable freezing rain (≥0.01 in) at the valid time.
- NDFD T-Storm (Chance—red hatching): There is a 25 to less than 55 percent probability of thunderstorms at the valid time. Areas are displayed with diagonal red hatching enclosed in a red border.
- NDFD T-Storm (Likely and/or Severe—dark red): There is a greater than or equal to 55 percent probability of thunderstorms, and/or the potential exists for some storms to reach severe levels at the valid time.
27.10.1.2 Symbols
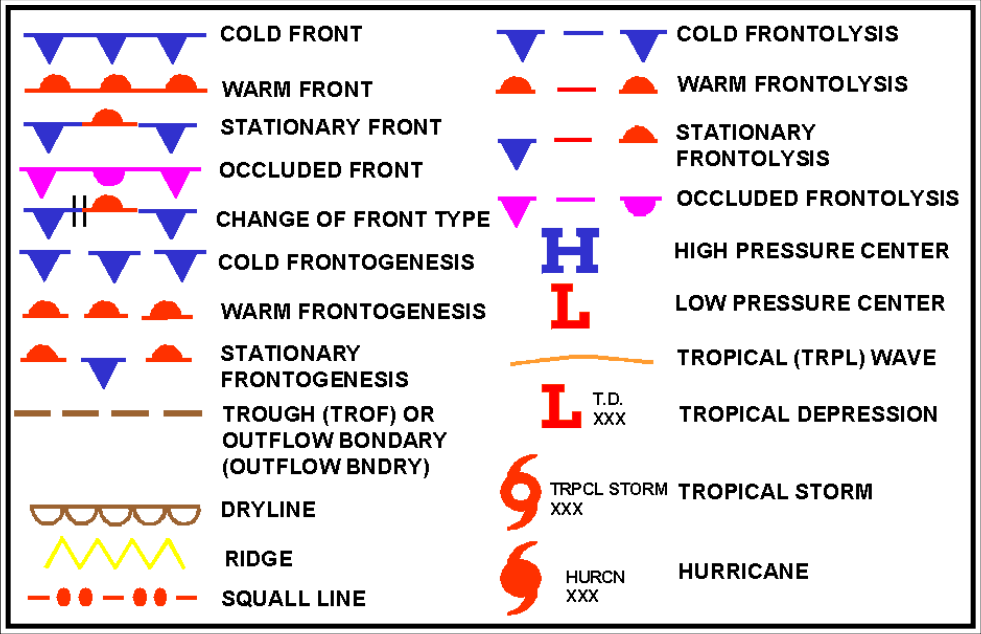
Figure 27-25 shows the Surface Prog Forecast symbols.
27.10.1.3 Pressure Systems
Pressure systems are depicted by pressure centers, troughs, isobars, drylines, tropical waves, tropical storms, and hurricanes using standard symbols (see Figure 27-25). Isobars are denoted by solid, thin black lines and labeled with the appropriate pressure in millibars. The central pressure is plotted near the respective pressure center.
27.10.1.4 Fronts
Fronts are depicted using the standard symbols in Figure 27-25.
27.10.1.5 Squall Lines
Squall lines are denoted using the standard symbol in Figure 27-25.
27.11 Upper Air Forecasts
NWP models, run on supercomputers, generate surface and upper air forecasts, known as “Model Guidance,” to meteorologists. The NWS NCO runs several models daily and produces hundreds of surface and upper-air guidance products, valid from model run time (i.e., 00-hour) out to several days or weeks (e.g., 340 hours after model run time) depending on the model. Their “Model Analyses and Guidance” website (see Figure 27-26) contains a User’s Guide as well as a Product Description Document that provides details on the various products.
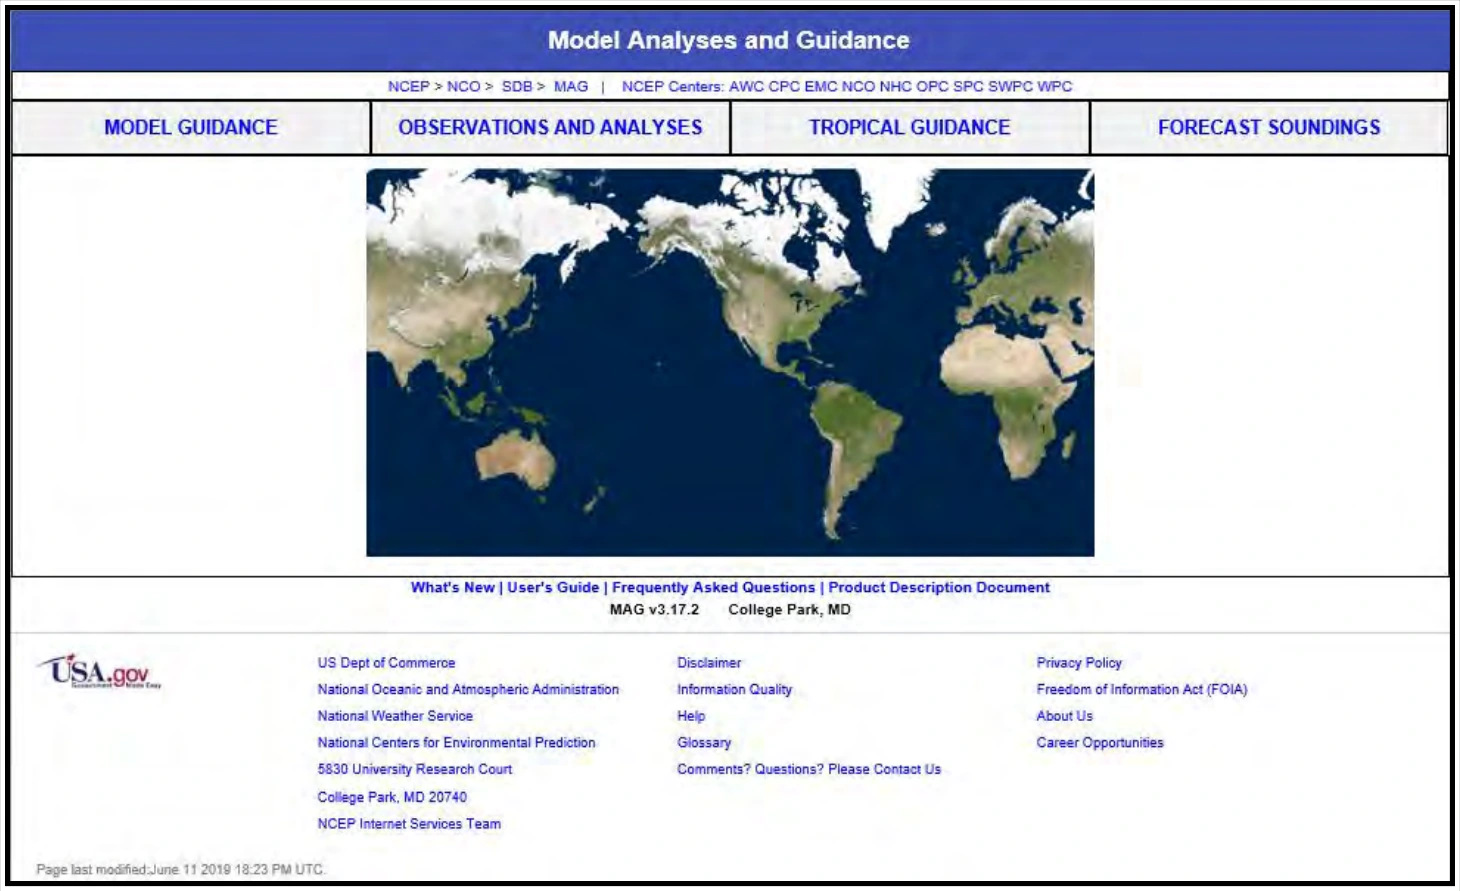
A User’s Guide, located below the image (lower left), provides descriptions, details, and examples of the various products.