
Chapter 27
Forecasts
27.11.1 Constant Pressure Level Forecasts
Constant pressure level forecasts (see Figure 27-27) are just one of the many products produced by NWP models. Constant pressure level forecasts are the computer model’s depiction of select weather (e.g., wind) at a specified constant pressure level (e.g., 300 mb), along with the altitudes (in meters) of the specified constant pressure level. When considered together, constant pressure level forecasts describe the 3D aspect of pressure systems. Each product provides a plan-projection view of a specified pressure altitude at a given forecast time.
Constant pressure level forecasts are used to provide an overview of weather patterns at specified times and pressure altitudes and are the source for wind and temperature aloft forecasts.
Pressure patterns cause and characterize much of the weather. Typically, lows and troughs are associated with clouds and precipitation while highs and ridges are associated with fair weather, except in winter when valley fog may occur. The location and strength of the jet stream can be viewed at 300 mb, 250 mb, and 200 mb levels.
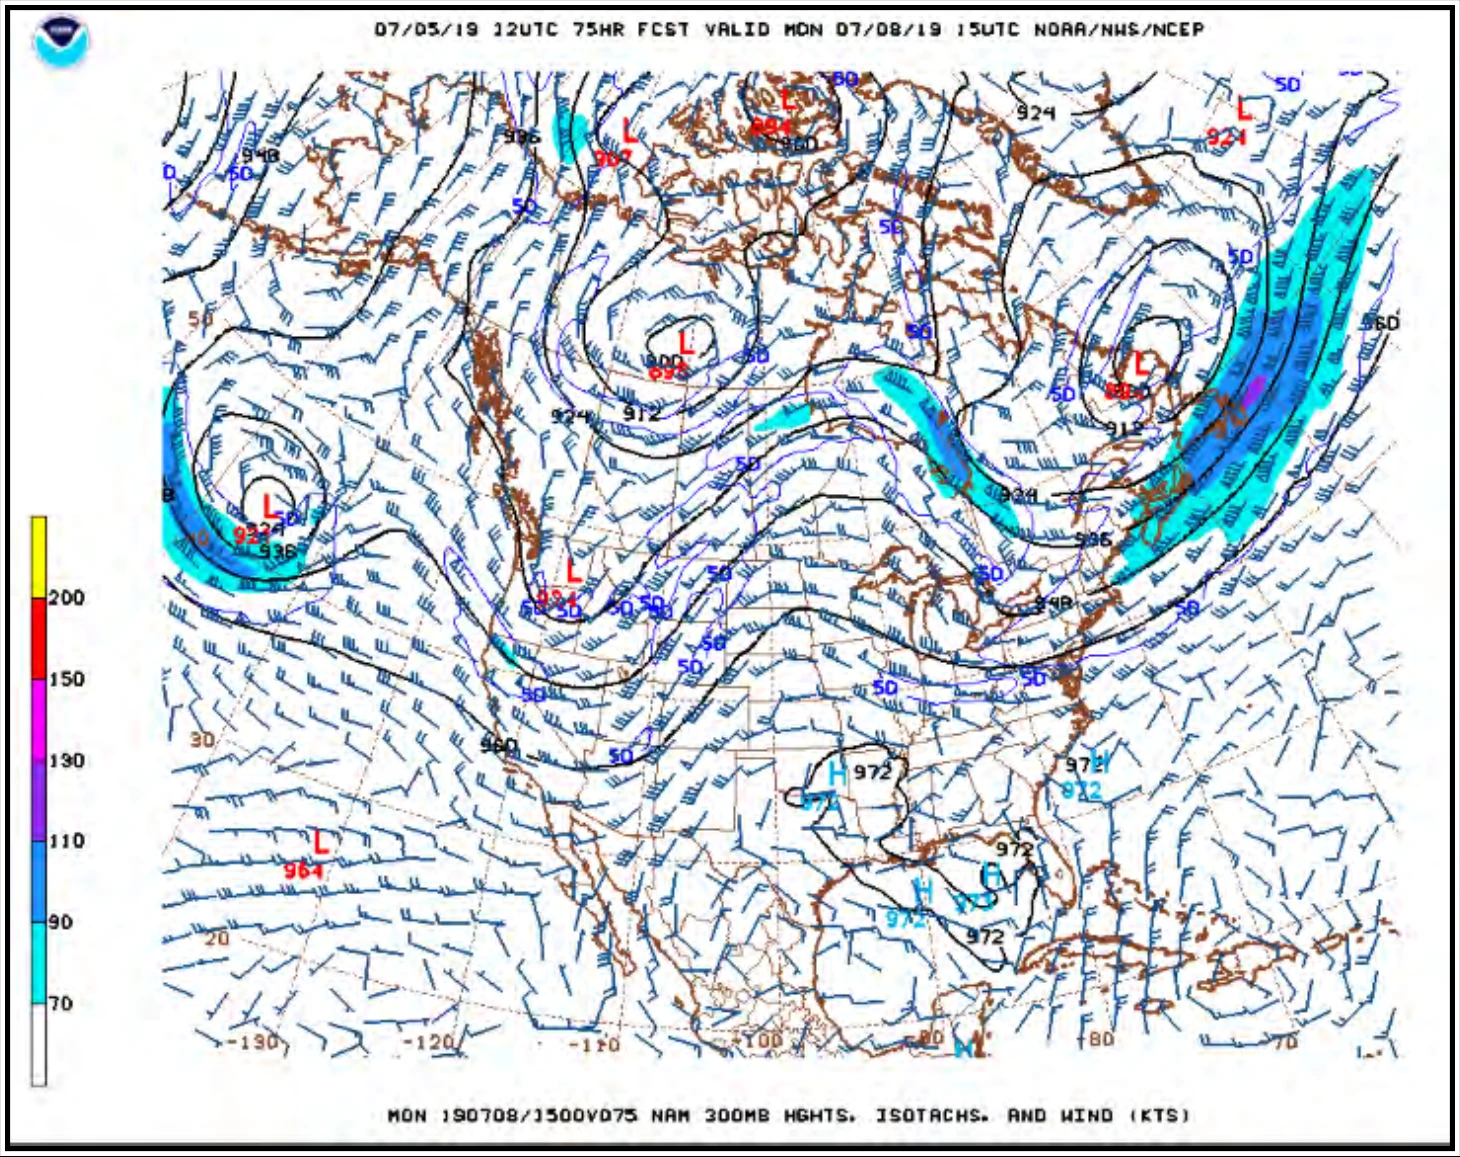
Contours of the height of the 300 mb surface are presented as solid lines. Wind barbs are used to show the direction and speed of the wind. Shading is done for wind speeds greater than 70 kt and generally represents the jet stream.
27.11.1.1 Issuance
Constant pressure level forecasts are produced several times a day depending on the model. The NCEP’s GFS model and North American Model (NAM) produce forecasts four times per day, with initial times of 00, 06, 12, and 18 UTC. Other higher resolution models such as the High-Resolution Rapid Refresh (HRRR) produce forecasts at hourly intervals.
27.11.1.2 Content
Constant pressure level forecasts vary in content depending on the selected model and product. Most provide a wind forecast that may be combined with temperature, relative humidity, or certain derived parameters (e.g., vorticity).
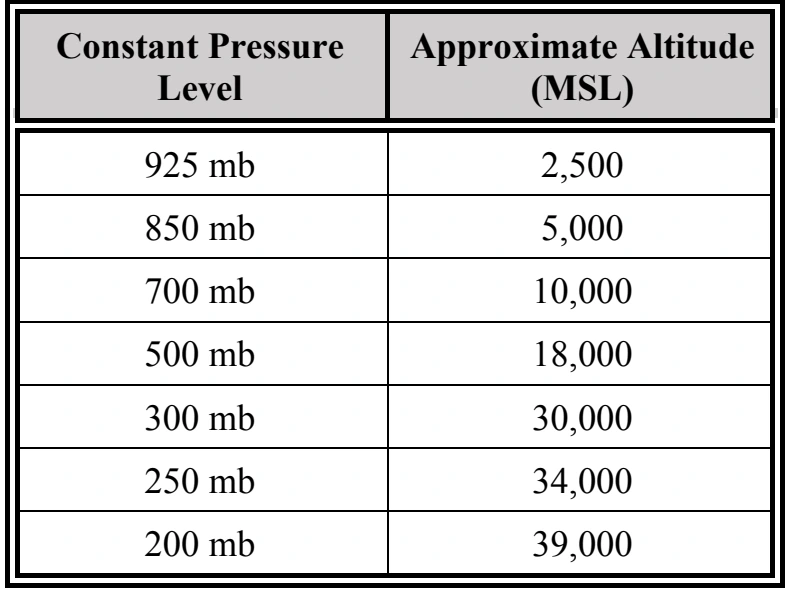
Many constant pressure levels are available for display, depending on the model. For example, the NCEP’s “Model Analyses and Guidance” website (see Figure 27-26) provides displays of the NCEP’s GFS model constant pressure levels contained in Table 27-14. It should be noted that the levels provided on the website are only a subset of the levels available from the model that are routinely made available to NWS meteorologists and others (e.g., 400 mb, 600 mb).
27.12 Freezing Level Forecast Graphics
The freezing level forecast graphics provide an initial analysis and forecasts at specified times into the future. The forecasts are based on output from NWS computer models. They supplement the forecast freezing level information contained in the icing AIRMETs.
The freezing level is the lowest altitude in the atmosphere over a given location at which the air temperature reaches 0°C. This altitude is also known as the height of the 0°C constant-temperature surface. A freezing level forecast graphic shows the height of the 0°C constant-temperature surface.
The initial analysis and forecast graphics are updated hourly. The colors represent the height in hundreds of feet above MSL of the lowest freezing level. Regions with white indicate the surface and the entire depth of the atmosphere are below freezing. Hatched or spotted regions (if present) represent areas where the surface temperature is below freezing with multiple freezing levels aloft.
More information on the freezing level forecast graphics is available on the AWC’s website.
27.13 Forecast Icing Product (FIP)
The NWS produces the Forecast Icing Product which is derived from NWS computer model data with no forecaster modifications. The FIP provides the same suite of products as the CIP (see Section 25.5), describing the icing environment in the future and being solely NWP model based. Information on the graphics is determined from NWP model output; observational data, including WSR-88D; satellite, PIREPs, and surface weather reports; and lightning network data.
FIPs contain a heavy intensity level. Heavy icing is defined as the accretion of ¼ inch of ice on the airfoil in < 15 minutes. This is a relative value and the use of which should take into account the airframe and the level of icing protection provided by the aircraft. The ultimate safety factor is the vigilance demonstrated by the pilot in potential icing situations.