
Chapter 27
Forecasts
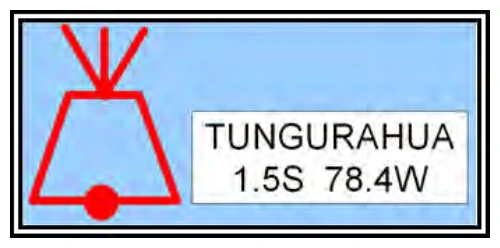
Volcanic eruption sites are identified by a trapezoidal symbol depicted in Figure 27-22. The dot on the base of the trapezoid identifies the location of the volcano. The name of the volcano, its latitude, and its longitude are noted adjacent to the symbol.
27.9.4 Alaska Significant Weather (SIGWX) Charts
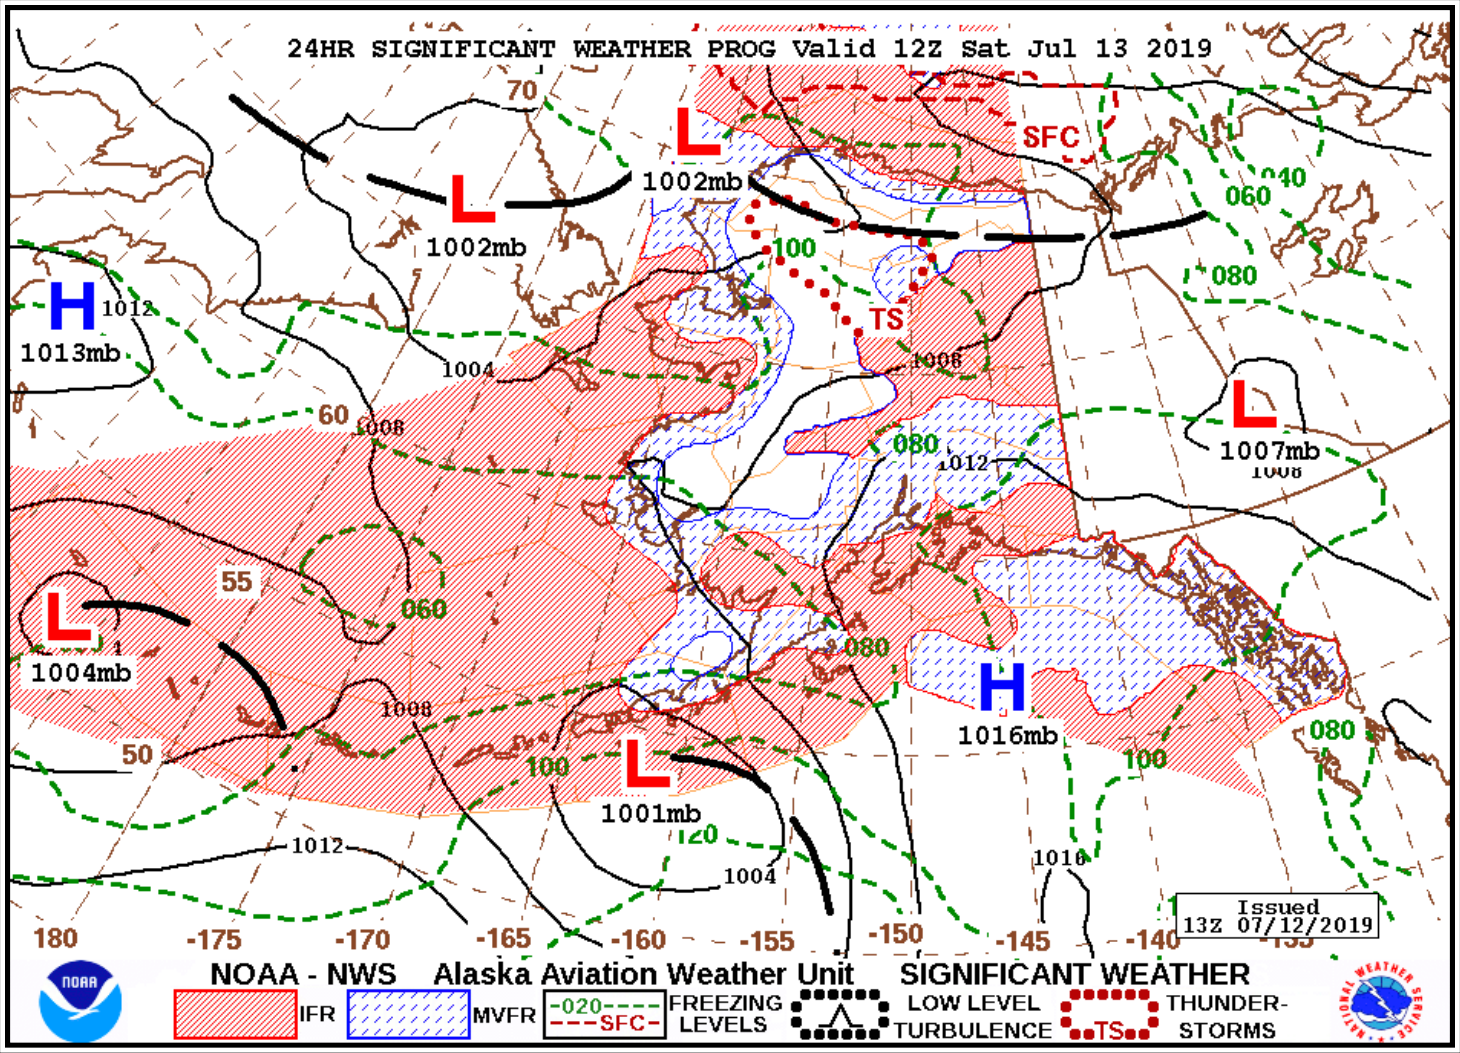
The Alaska SIGWX Charts (see Figure 27-23) are a series of four forecasts (24-hour, 36-hour, 48-hour, and 60-hour) valid at specified times. These charts provide a graphical overview of the specified forecast weather primarily for lower flight altitudes.
27.9.4.1 Issuance
The AAWU issues the Alaska SIGWX Charts (see Figure 27-23). These charts are issued twice a day at 0530 and 1330 UTC during Alaska Standard Time, and 0430 and 1230 UTC during Alaska Daylight Time. The 1330/1230 UTC-issued 24-hour SIGWX chart may be updated around 2145/2045 UTC valid at 1200 UTC the next day.
27.9.4.1.1 Content
27.9.4.1.1.1 Surface Pressure Systems and Fronts
Pressure systems and fronts are depicted using standard symbols. Isobars are denoted by solid, thin black lines and labeled with the appropriate pressure in millibars. The central pressure is plotted near the respective pressure center.
27.9.4.1.1.2 Areas of IFR and MVFR Weather Conditions
Areas of forecast IFR and MVFR conditions are shown in red and blue hatching, respectively.
27.9.4.1.1.3 Freezing Levels
Forecast freezing levels are depicted for the surface (dashed red line) and at 2,000-ft intervals (dashed green lines).
27.9.4.1.1.4 Low-Level Turbulence
Areas of forecast moderate or greater non-convective low-level turbulence are depicted with black dots. Turbulence altitudes are not included but can be considered as turbulence that is near the surface as a result of wind interactions with the terrain. In most cases, it would be within 6,000 ft above the terrain.
27.9.4.1.1.5 Thunderstorms
Areas of forecast thunderstorms are depicted with red dots. Thunderstorm areal coverage, cloud bases, and tops are not included.