Chapter 27
Forecasts
27.9.3.2.2 Moderate or Severe Turbulence
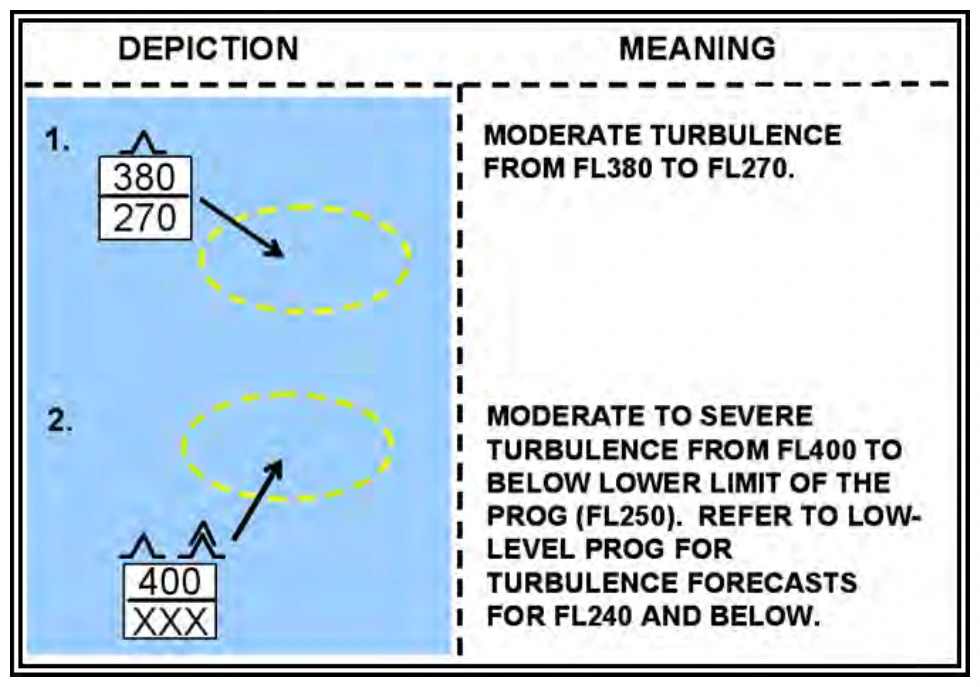
Forecast areas of moderate or severe turbulence (see Figure 27-18) associated with wind shear zones and/or mountain waves are enclosed by bold yellow dashed lines. Intensities are identified by standard symbols (see Table 27-12).
The vertical extent of turbulence layers is specified by top and base heights, separated by a horizontal line. Turbulence bases that extend below FL250 are identified with XXX.
Convective or thunderstorm turbulence is not identified.
27.9.3.2.3 Moderate or Severe Icing
Moderate or severe icing (outside of thunderstorms) above FL240 is rare and is generally not forecasted on High-Level SIGWX Charts.
27.9.3.2.4 Jet Streams
A jet stream axis with a wind speed of more than 80 kt is identified by a bold (green) line. An arrowhead is used to indicate wind direction. Wind change bars (double-hatched, light green lines) positioned along a jet stream axis identify 20-kt wind speed changes (see Figure 27-19).
Symbols and altitudes are used to further characterize a jet stream axis. A standard wind symbol (light green) is placed at each pertinent position to identify wind velocity. The FL is placed adjacent to each wind symbol to identify the altitude of the jet stream core or axis.
Jet stream vertical depth forecasts are included when the maximum speed is 120 kt or more. Jet depth is defined as the vertical depths to the 80-kt wind field above and below the jet stream axis using FLs. Jet depth information is placed at the maximum speed point only, normally at one point on each jet stream. When the jet stream is very long and there are several wind maxima, then each maximum should include forecasts of the vertical depth.
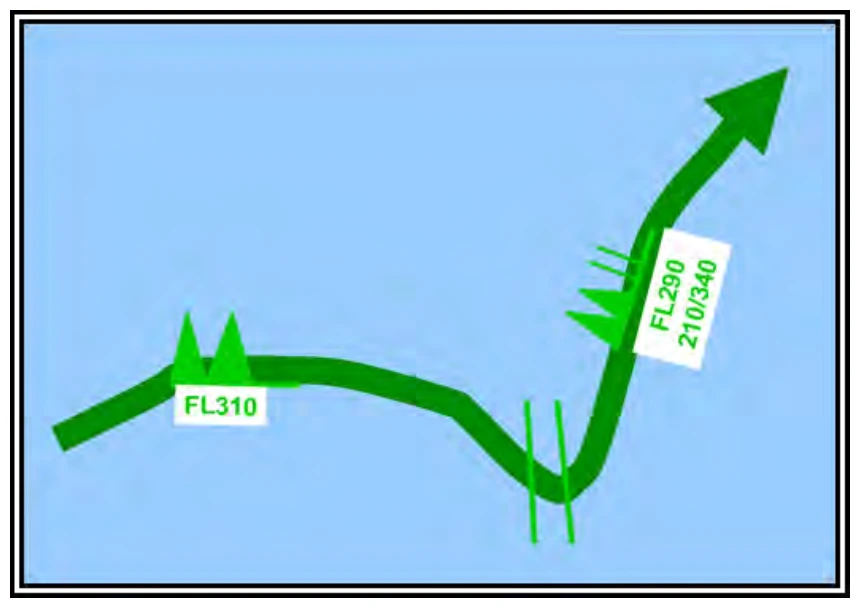
Forecast maximum speeds of 100 kt at FL310 at one location and 120 kt at FL290 at another location. At the latter location, the base of the 80-kt wind field is FL210, and the top of the 80-kt wind field is FL340.
27.9.3.2.5 Tropopause Heights
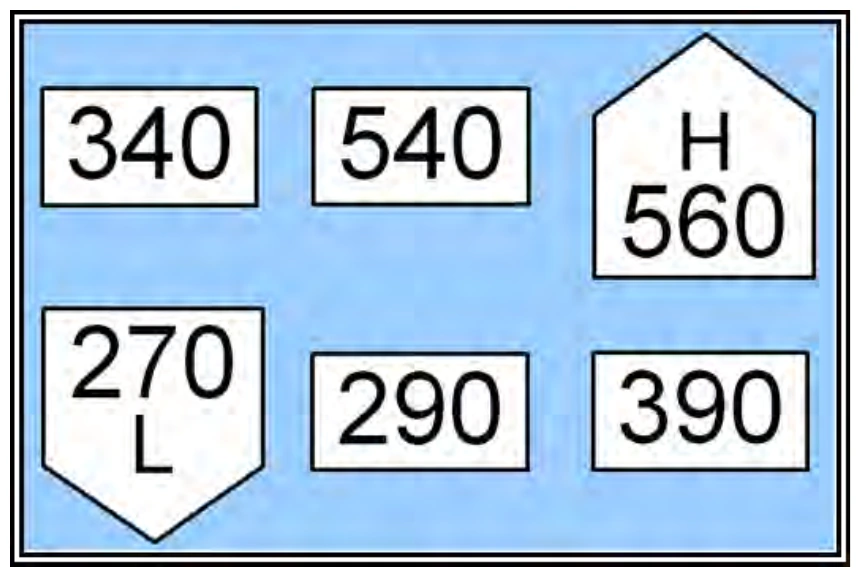
Tropopause heights are plotted at selected locations on the chart. They are enclosed by rectangles and plotted in hundreds of feet MSL (see Figure 27-20). Centers of high (H) and low (L) tropopause heights are enclosed by polygons and plotted in hundreds of feet MSL.
27.9.3.2.6 Tropical Cyclones
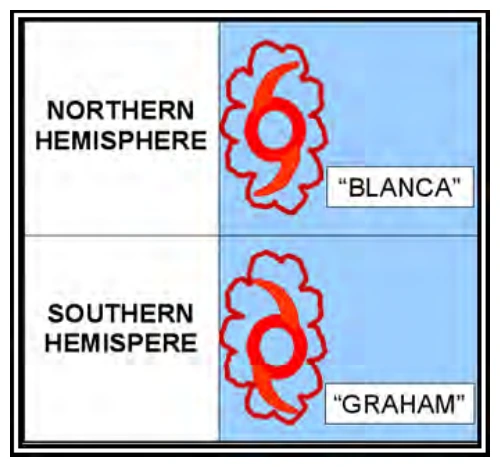
Tropical cyclones (i.e., with surface wind speed 34 kt or greater) are depicted by the symbol in Figure 27-21 with the storm’s name positioned adjacent to the symbol. Cumulonimbus clouds meeting chart criteria are identified and characterized relative to each storm.