
Chapter 27
Forecasts
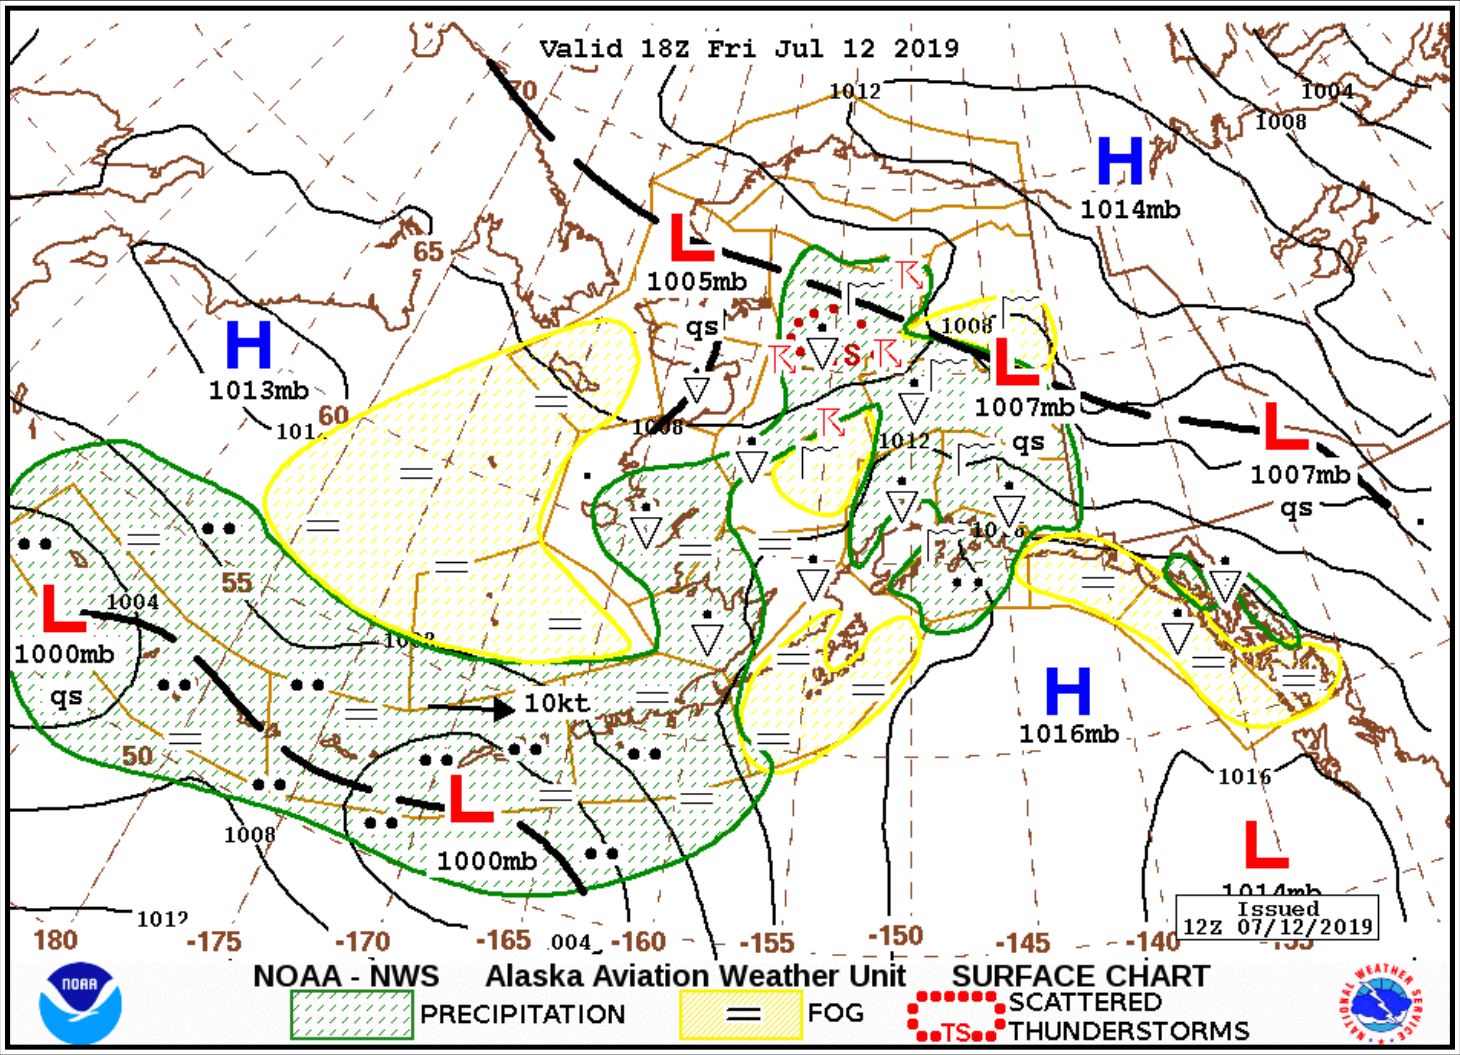
The Surface Forecast graphic (see Figure 27-5) illustrates prominent surface features, including sea level pressure, areas of high and low pressure, fronts and troughs, and precipitation. Each forecast shows the surface weather that can be expected within one hour of the designated time.
Areas of high pressure are depicted along with the maximum sea level pressure. Areas of low pressure are depicted with the minimum sea level pressure. The mean 12-hour motion of low-pressure systems is also shown. Areas of occasional or continuous precipitation and/or fog are represented by shaded regions (green for precipitation, yellow for fog), whereas isolated or scattered precipitation is not shaded. This product is issued every six hours with forecasts valid for 00Z, 06Z, 12Z, and 18Z.
27.7.3 Alaska Icing Forecast
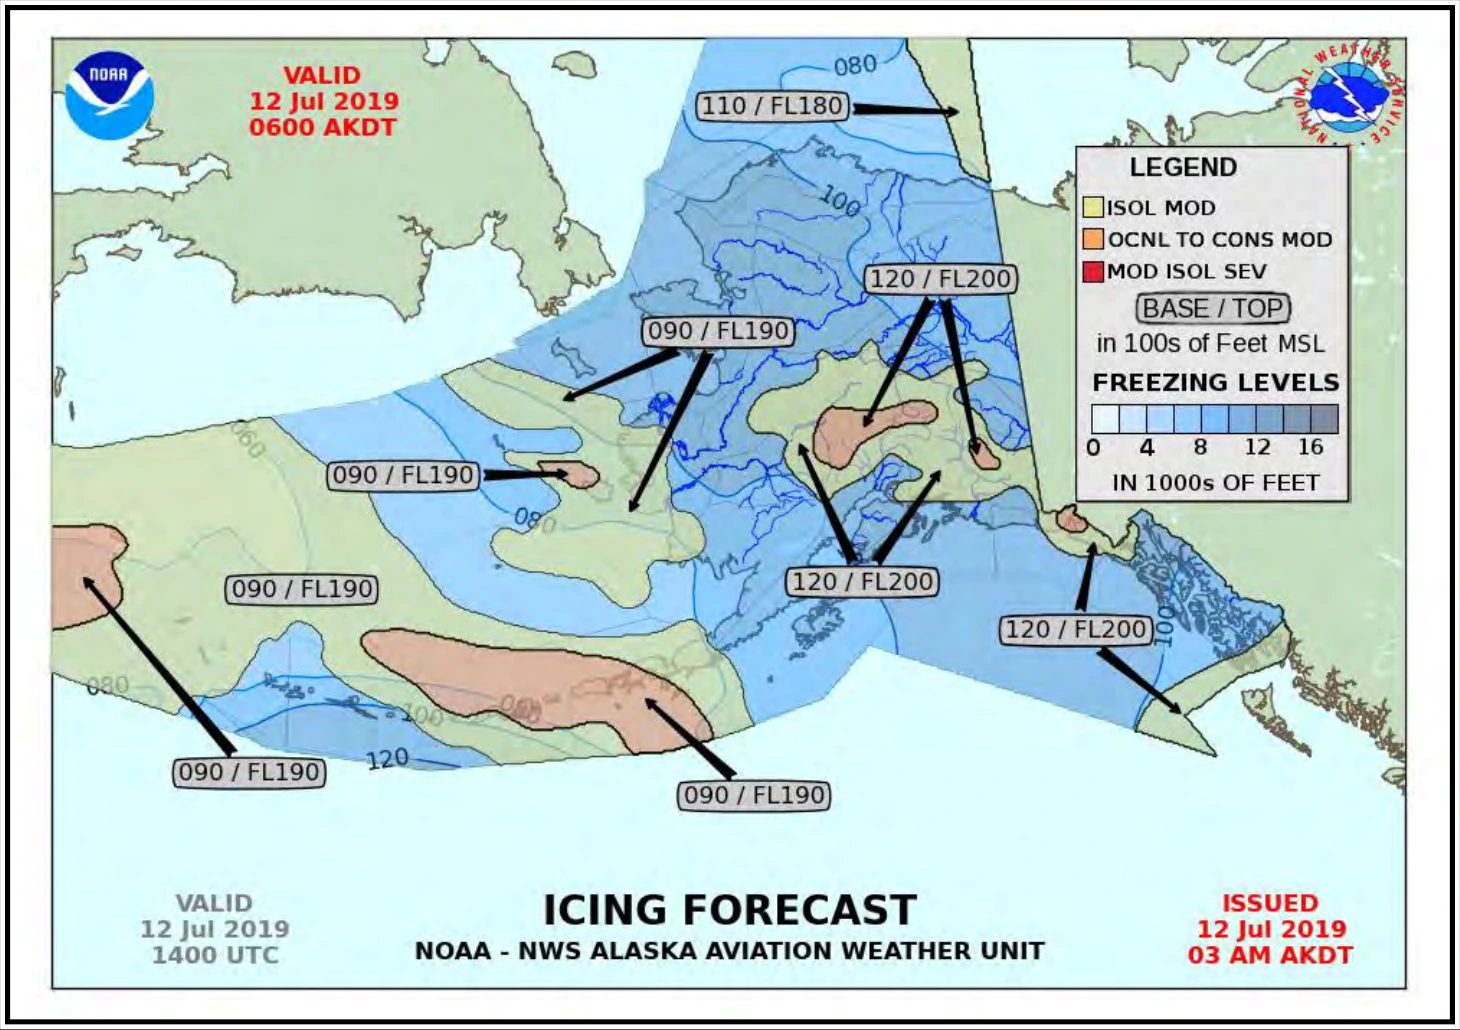
The Icing Forecast graphic (see Figure 27-6) provides information about freezing levels and the potential for significant icing at specified valid times.
Freezing level heights are blue-filled contours (every 2,000 ft). Areas of isolated (ISOL) moderate (MOD) icing are shaded yellow, areas of occasional (OCNL) or continuous (CONS) moderate icing are shaded orange, and red is used for moderate with isolated severe (SEV) icing (refer to SIGMETs for occasional or greater severe icing). These forecasts are issued every eight hours and amended as needed.
27.7.4 Alaska Turbulence Forecast
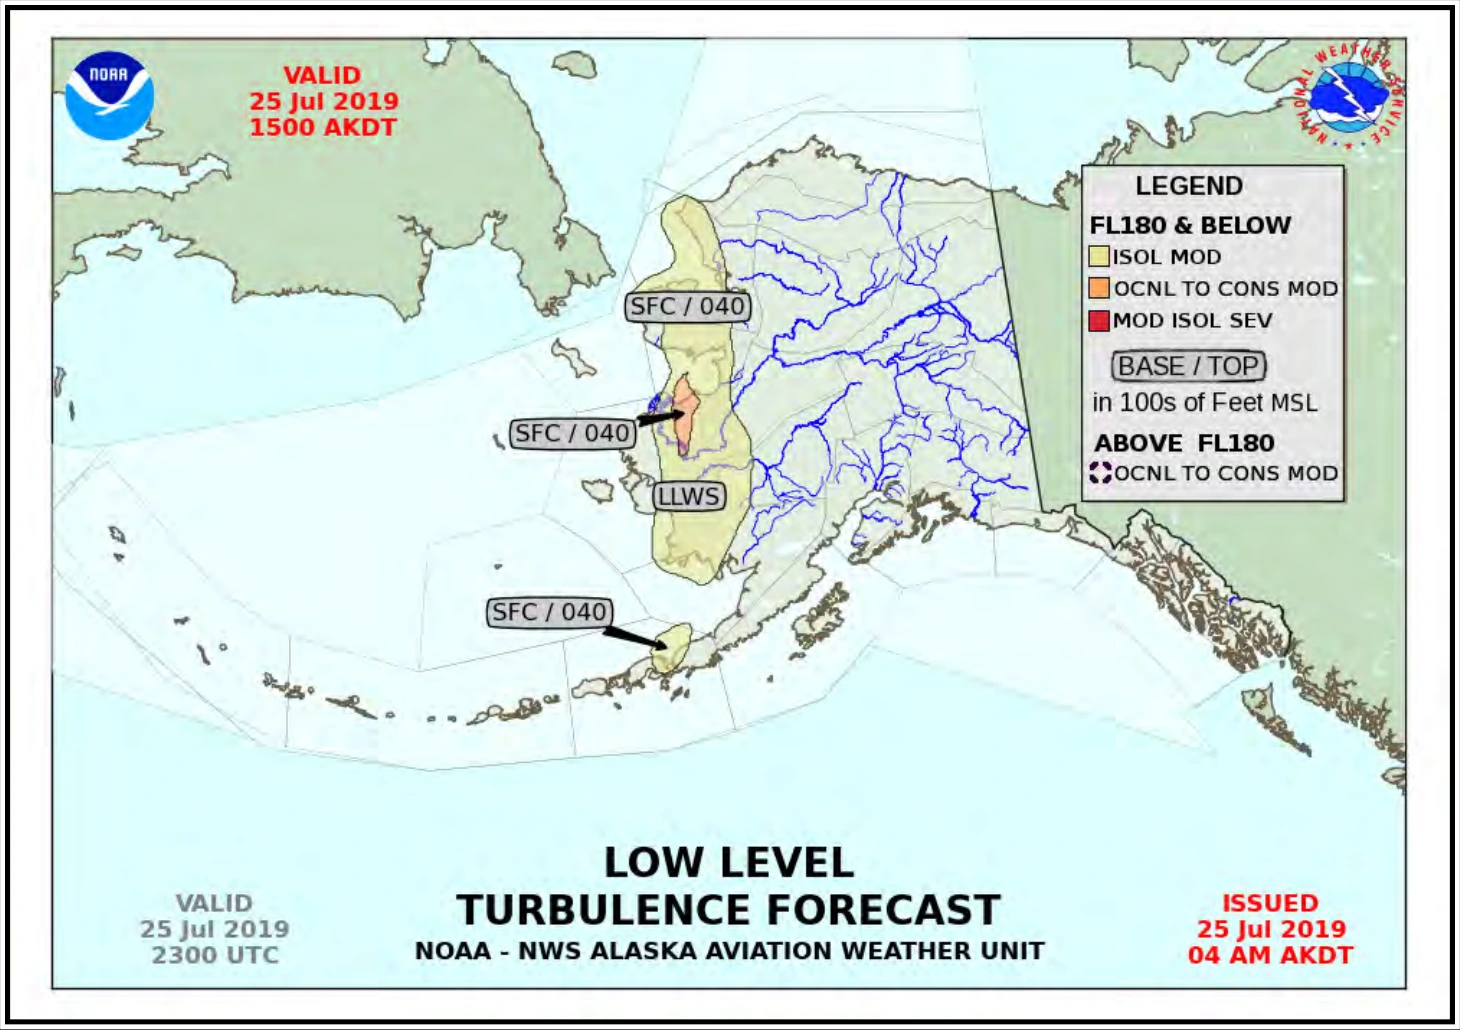
The Turbulence Forecast graphic (see Figure 27-7) depicts areas of significant turbulence at specified valid times.
Areas of isolated (ISOL) moderate (MOD) turbulence are shaded yellow, areas of occasional (OCNL) or continuous (CONS) moderate turbulence are shaded orange, and red is used for moderate with isolated severe (SEV) turbulence (refer to SIGMETs for occasional or greater severe turbulence).
Separate graphics are provided for low-level (defined for this product as FL180 and below) and high-level (defined for this product as above FL180) turbulence.
27.7.5 Alaska Convective Outlook
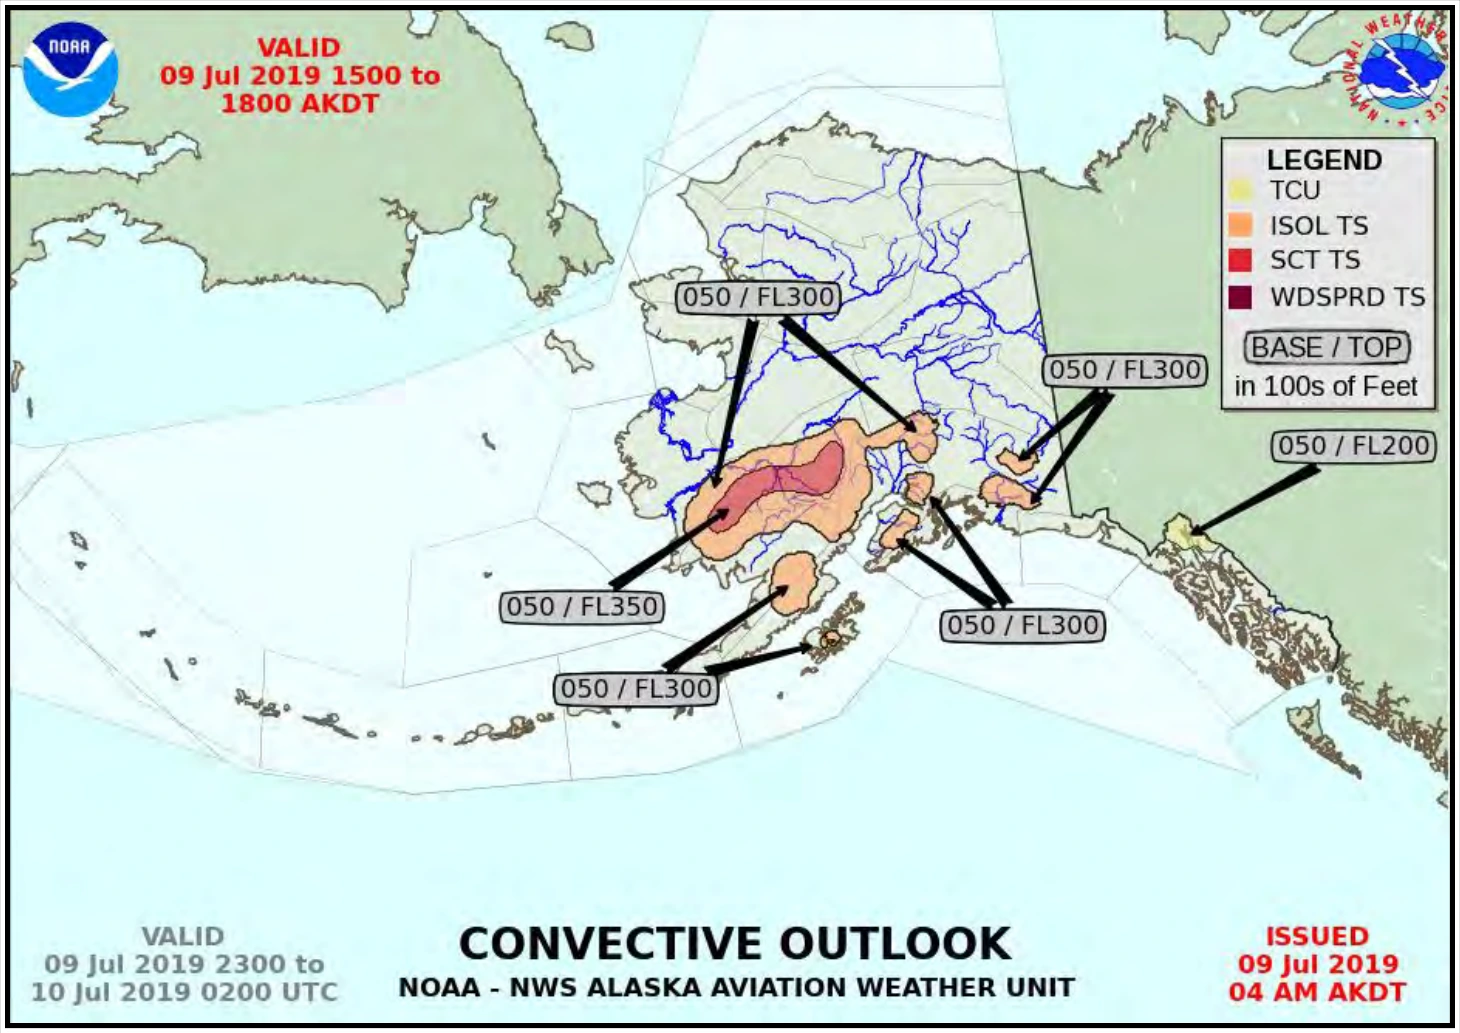
The Convective Outlook graphic (see Figure 27-8) is a seasonal product that provides information about convective activity at specific valid times. Each forecast indicates where conditions are favorable for the development of towering cumulus and thunderstorms.
Locations of towering cumulus are depicted in yellow. Locations of isolated (ISOL), scattered (SCT), and widespread (WDSPRD) thunderstorms (TS) are depicted in orange, red, and dark red, respectively. Cloud bases and tops are also depicted.
27.8 World Area Forecast System (WAFS)
ICAO’s WAFS supplies aviation users with global aeronautical meteorological en route forecasts suitable for use in flight-planning systems and flight documentation.
Two WAFCs, WAFC Washington and WAFC London, have the responsibility to issue the WAFS forecasts. WAFC Washington is operated by the NWS NCO in College Park, MD, and the NWS AWC in Kansas City, MO. WAFC London is operated by the United Kingdom’s Meteorological Office in Exeter, United Kingdom.