
Chapter 27
Forecasts
Both WAFC Washington and WAFC London issue the following WAFS forecasts in accordance with ICAO Annex 3, Meteorological Service for International Air Navigation.
- Global forecasts of:
- Upper wind and temperature (i.e., wind and temperature aloft, which is also issued in chart form for select areas);
- Upper air humidity;
- Geopotential altitude of FLs;
- FL and temperature of tropopause (i.e., tropopause forecast);
- Direction, speed, and FL of maximum wind;
- Cumulonimbus clouds;
- Icing; and
- Turbulence.
- Global forecasts of SIGWX (i.e., High-Level SIGWX forecasts) (see Section 27.9.3).
- Select regional areas of Mid-Level SIGWX forecasts (see Section 27.9.2).
27.8.1.1 Issuance
The WAFS forecasts of upper wind, temperature, and humidity; direction, speed, and FL of maximum wind; FL and temperature of tropopause; areas of cumulonimbus clouds; icing; turbulence; and geopotential altitude of FLs are issued four times a day by both WAFC Washington and WAFC London.
These forecasts are produced from weather computer models and are not modified by WAFC forecasters. WAFC Washington’s forecast is from the Global Forecast System (GFS) model. These forecasts are issued in grid-point format (i.e., WMO Gridded Binary, Edition 2 (GRIB2) format).
These forecasts are valid for fixed valid times at 6, 9, 12, 15, 18, 21, 24, 27, 30, 33, and 36 hours after the time (0000, 0600, 1200, and 1800 UTC) on which the forecasts were based. Additional valid times are planned to be implemented in 2024.
27.8.1.2 WAFS Wind and Temperature Forecasts
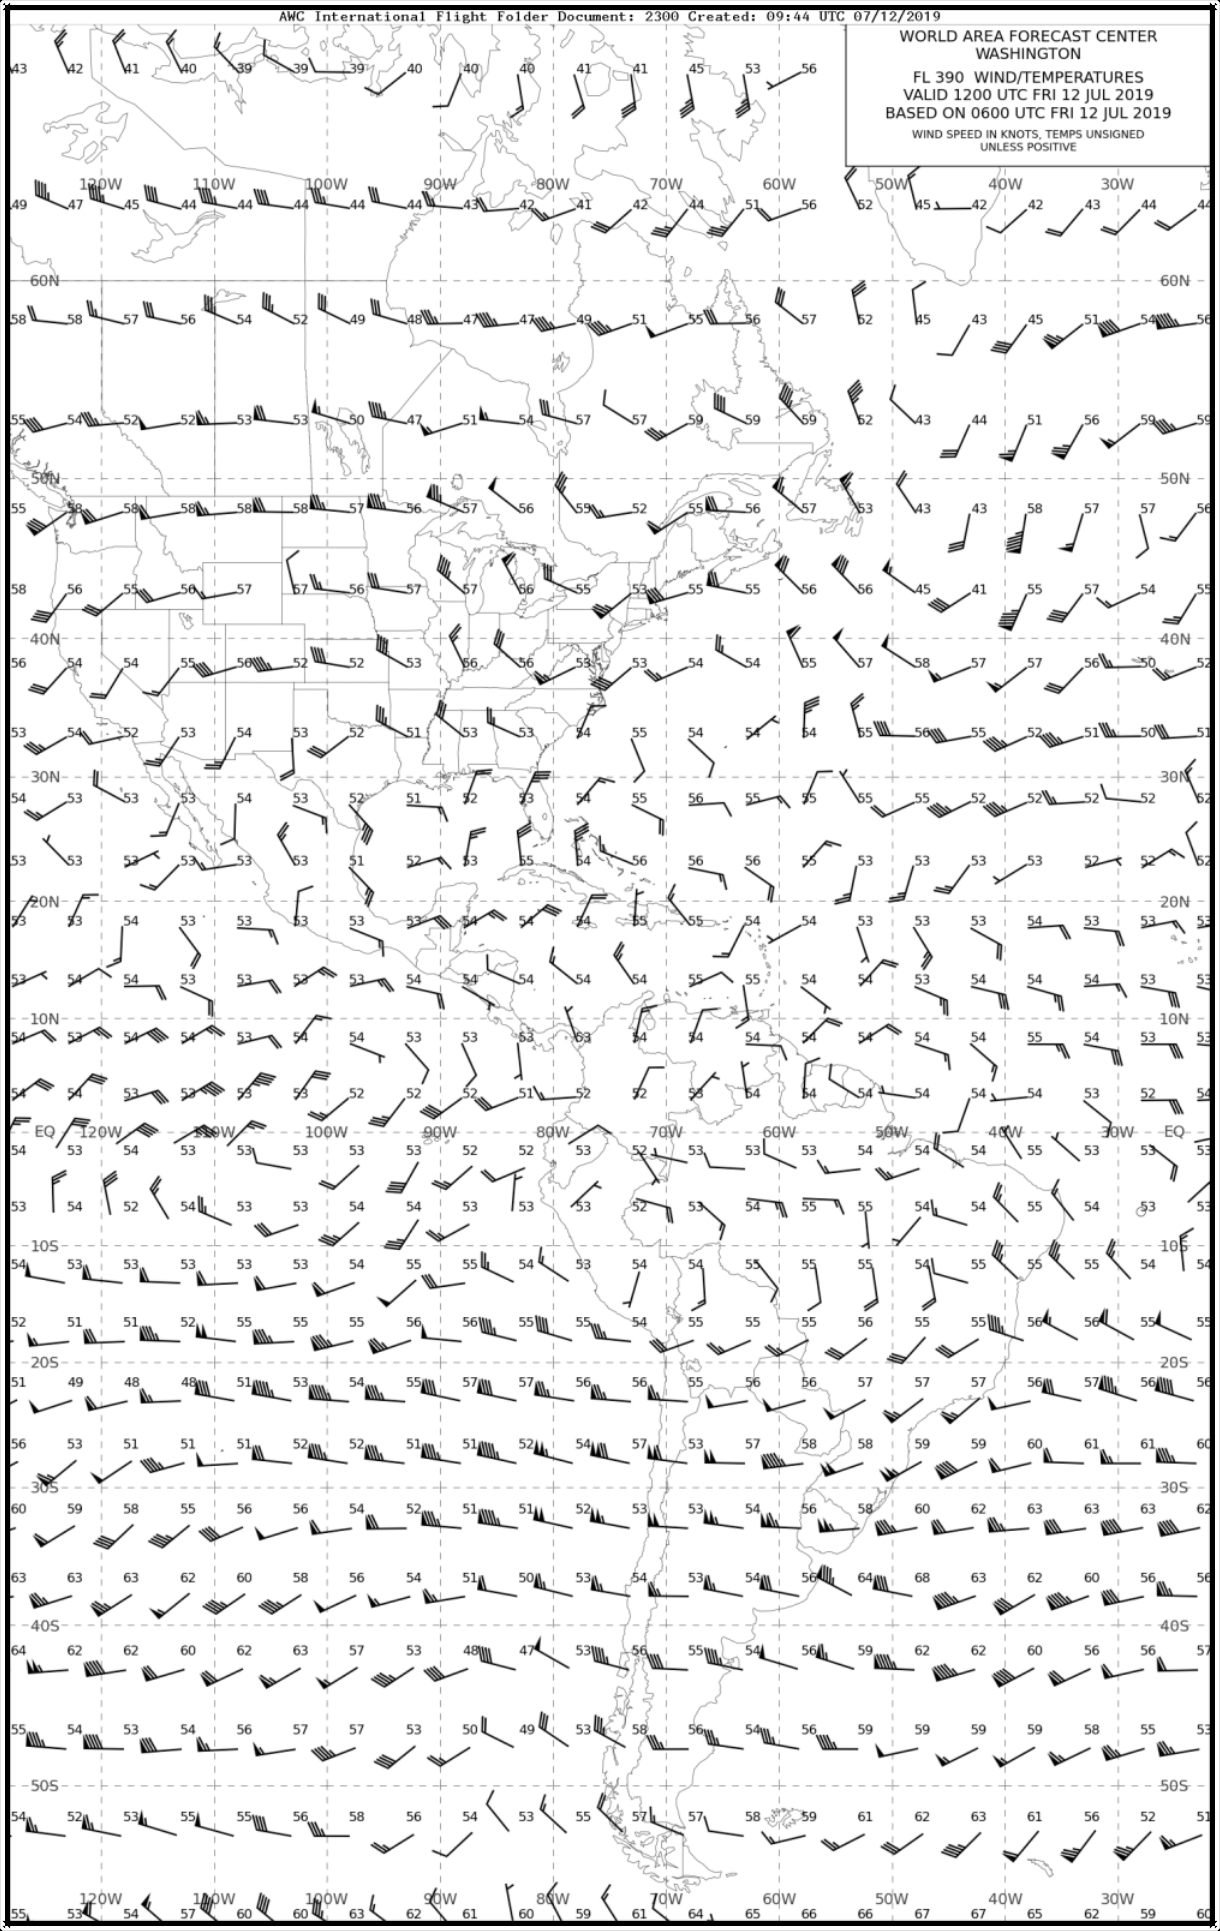
Wind and temperature forecasts are issued for FLs 050 (850 mb), 100 (700 mb), 140 (600 mb), 180 (500 mb), 240 (400 mb), 270 (350 mb), 300 (300 mb), 320 (275 mb), 340 (250 mb), 360 (225 mb), 390 (200 mb), 410 (175 mb), 450 (150 mb), and 530 (100 mb).
WAFC wind and temperature forecasts use a plotting model where the air temperature (degrees Celsius) is the center of the data point and the wind direction and speed follows the standard model (see Figure 27-9) with the exception that wind speed for points in the Southern Hemisphere is flipped. Note that the data points do not correspond to any airports or reference points with names or identifiers.
WAFS global wind and temperature forecasts are provided in grid point format (e.g., computer format) for use in flight-planning systems. Chart format is also provided on the AWC’s website.
27.8.1.3 Humidity, Maximum Wind, and Tropopause Forecasts
No specific charts are issued for global upper air humidity, maximum wind, height of tropopause, and altitude of FLs. These products are provided in grid point format (e.g., computer format) for use in flight-planning systems. Data from these forecasts are used by the WAFC forecasters to produce the High-Level and Medium-Level SIGWX forecasts, which contain tropopause and jet stream forecasts.
Humidity data is produced for FLs 50 (850 mb), 100 (700 mb), 140 (600 mb), and 180 (500 mb). Additional valid times are planned to be implemented in 2024.
27.8.1.4 WAFS Turbulence, Icing, and Cumulonimbus Cloud Forecasts
WAFS global turbulence, icing, and cumulonimbus cloud forecasts are provided in grid point format (e.g., computer format) for use in flight-planning systems, but the AWC does make these available on their website in web display format and not chart format. The web display allows the user to select various products and FLs and view the forecasts as single time steps or in a movie-loop sequence. More detailed information is provided on the AWC’s website.
The WAFS global turbulence, icing, and cumulonimbus cloud forecasts are actually a blend of the WAFC Washington global turbulence, icing, and cumulonimbus cloud forecasts and the WAFC London global turbulence, icing, and cumulonimbus cloud forecasts. In other words, each WAFC produces their own global turbulence, icing, and cumulonimbus cloud forecasts using their own global computer models (WAFC Washington uses the NCEP’s GFS model). The two WAFCs’ forecasts, for turbulence, icing, and cumulonimbus cloud only, are then merged together to eliminate any differences between the two sets of forecasts.
27.9 Significant Weather (SIGWX)
SIGWX forecasts may be depicted in monochrome or color display. The colors used for symbols as well as the color and style of lines are not standard. The colors of jet streams, turbulence, cloud cover, and other elements may vary depending on the website and service provider. The examples shown in this section are from the NWS AWC’s and the AAWU’s websites. Refer to any legend, Help Page, or user information on the websites for details on the content and display of the weather information.