
Chapter 27
Forecasts
27.9.1 Low-Level Significant Weather (SIGWX) Charts
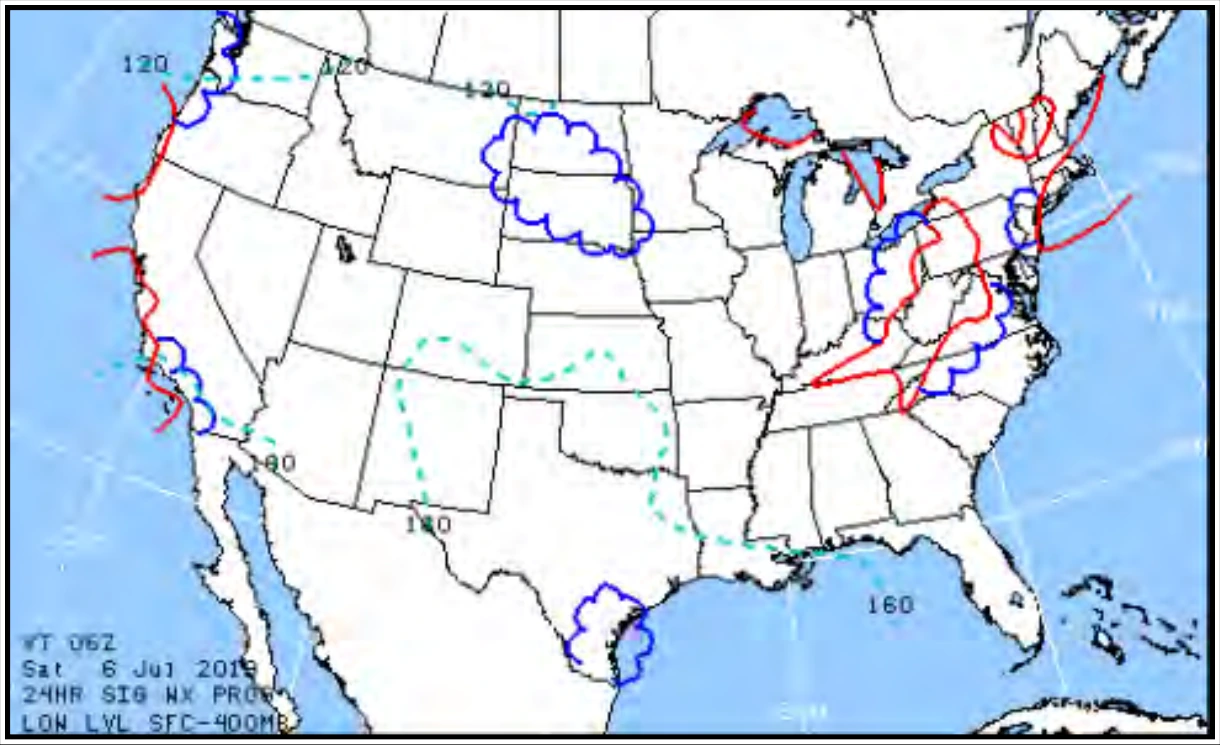
The Low-Level SIGWX Charts (see Figure 27-10) provide an overview of selected aviation weather hazards up to FL240 at 12 and 24 hours into the future.
The forecast domain covers the CONUS and the coastal waters. Each depicts a “snapshot” of weather expected at the specified valid time.
27.9.1.1 Issuance
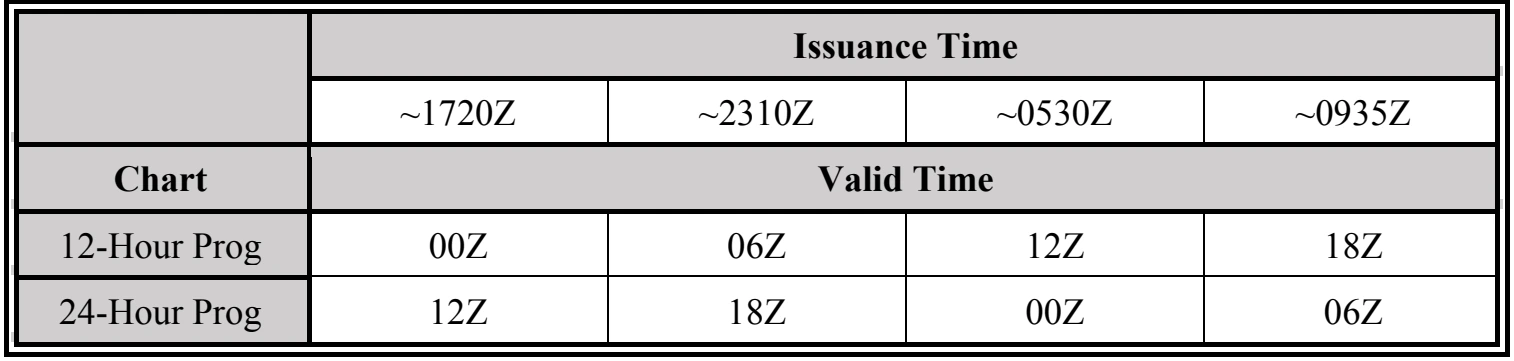
Low-Level SIGWX Charts are issued four times per day by the NWS AWC (see Table 27-10). Two charts are issued: a 12-hour and a 24-hour prognostic (prog) chart.
27.9.1.2 Content
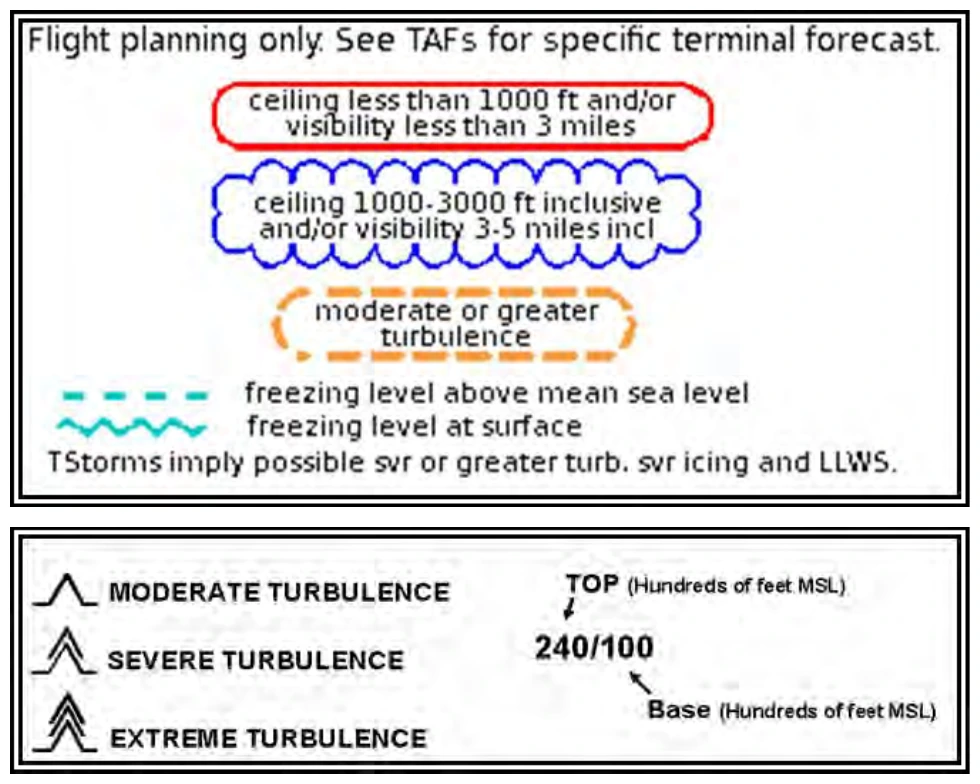
Low-Level SIGWX Charts depict weather flying categories, turbulence, and freezing levels (see Figure 27-11). In-flight icing is not depicted on the Low-Level SIGWX Chart.
Depending on the website or service provider, the Low-Level SIGWX Charts may be combined with Surface Prog Charts to create a four-panel presentation. For example, the left two panels represent the 12-hour forecast interval and the right two panels represent the 24-hour forecast interval. The upper two panels depict the SIGWX Charts and the lower two panels the Surface Prog.
27.9.1.2.1 Flying Categories
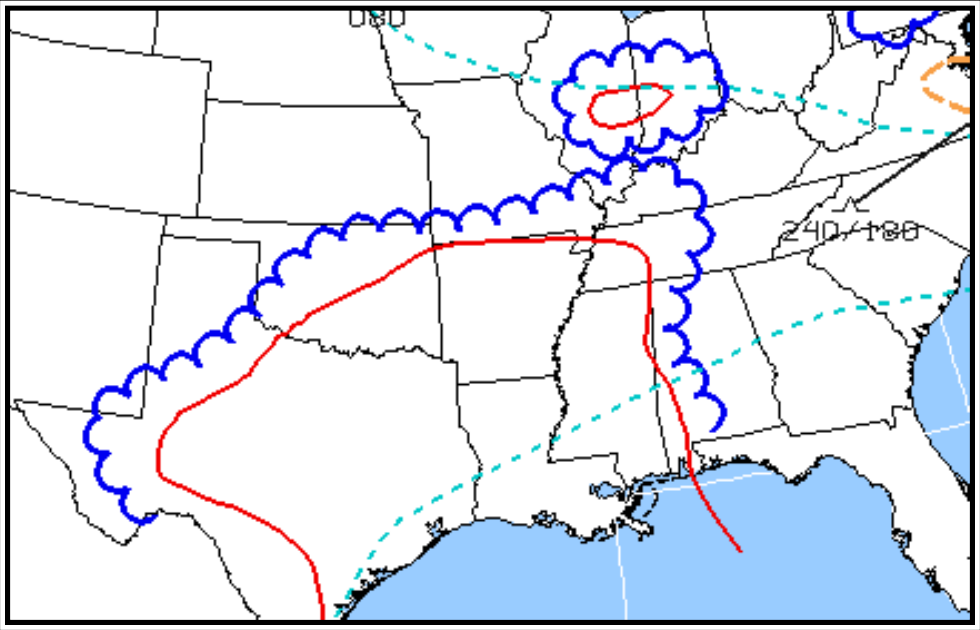
IFR areas are outlined with a solid red line, MVFR areas are outlined with a scalloped blue line, and VFR areas are not depicted (see Figure 27-12).
27.9.1.2.2 Turbulence
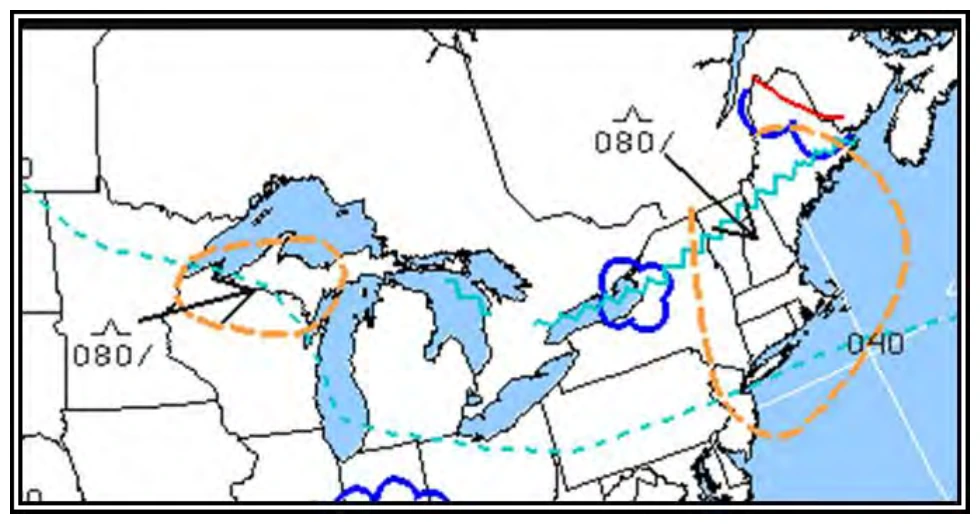
Areas of moderate or greater turbulence are enclosed by bold, dashed, brown lines (see Figure 27-13). Turbulence intensities are identified by standard symbols (see Figure 27-11). The vertical extent of turbulence layers is specified by top and base heights separated by a slant. The intensity symbols and height information may be located within or adjacent to the forecasted areas of turbulence. If located adjacent to an area, an arrow will point to the associated area. Turbulence height is depicted by two numbers separated by a solidus (/). For example, an area on the chart with turbulence indicated as 240/100 indicates that the turbulence can be expected from the top at FL240 to the base at 10,000 ft MSL. When the base height is omitted, the turbulence is forecast to reach the surface. For example, 080/ identifies a turbulence layer from the surface to 8,000 ft MSL. Turbulence associated with thunderstorms is not depicted on the chart.
27.9.1.2.3 Freezing Levels
The freezing level at the surface is depicted by a blue, saw-toothed symbol (see Figure 27-14). The surface freezing level separates above-freezing from below-freezing temperatures at the Earth’s surface.