
Chapter 27
Forecasts
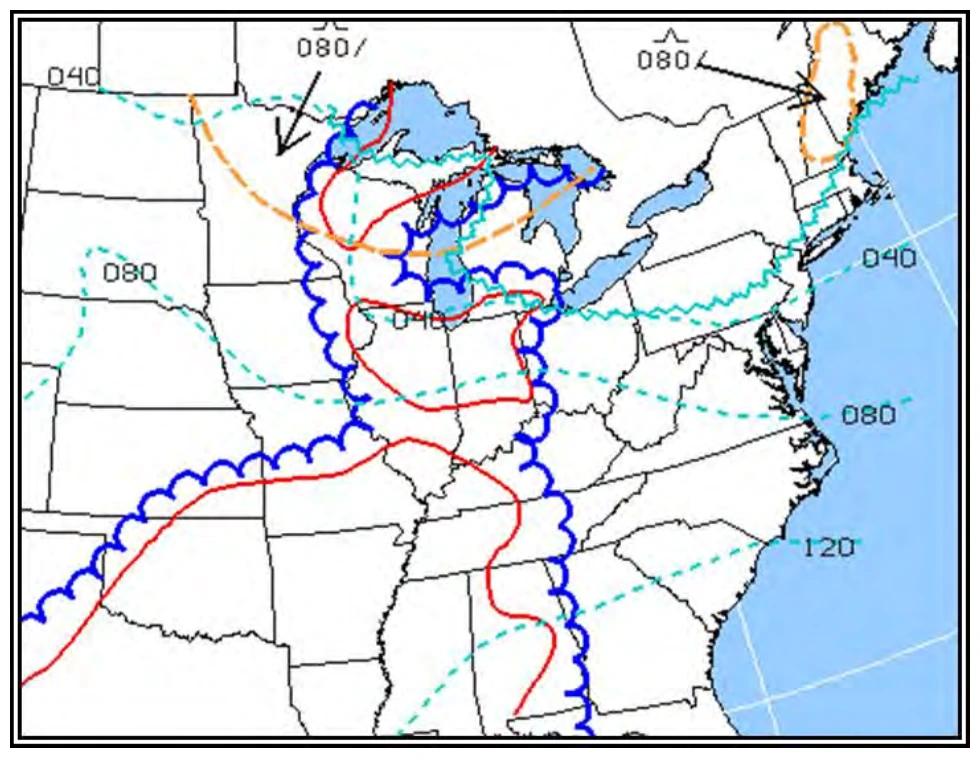
Freezing levels above the surface are depicted by blue dashed lines labeled in hundreds of feet MSL beginning at 4,000 ft using 4,000-ft intervals (see Figure 27-14). If multiple freezing levels exist, these lines are drawn to the highest freezing level. For example, 80 identifies the 8,000-ft freezing level contour (see Figure 27-14). The lines are discontinued where they intersect the surface.
The freezing level for locations between lines is determined by interpolation. For example, the freezing level midway between the 4,000 and 8,000-ft lines is 6,000 ft.
Multiple freezing levels occur when the temperature is 0°C at more than one altitude aloft (see Figure 27-15). Multiple freezing levels can be forecasted on the Low-Level SIGWX Prog Charts in situations where the temperature is below freezing (negative) at the surface with multiple freezing levels aloft.
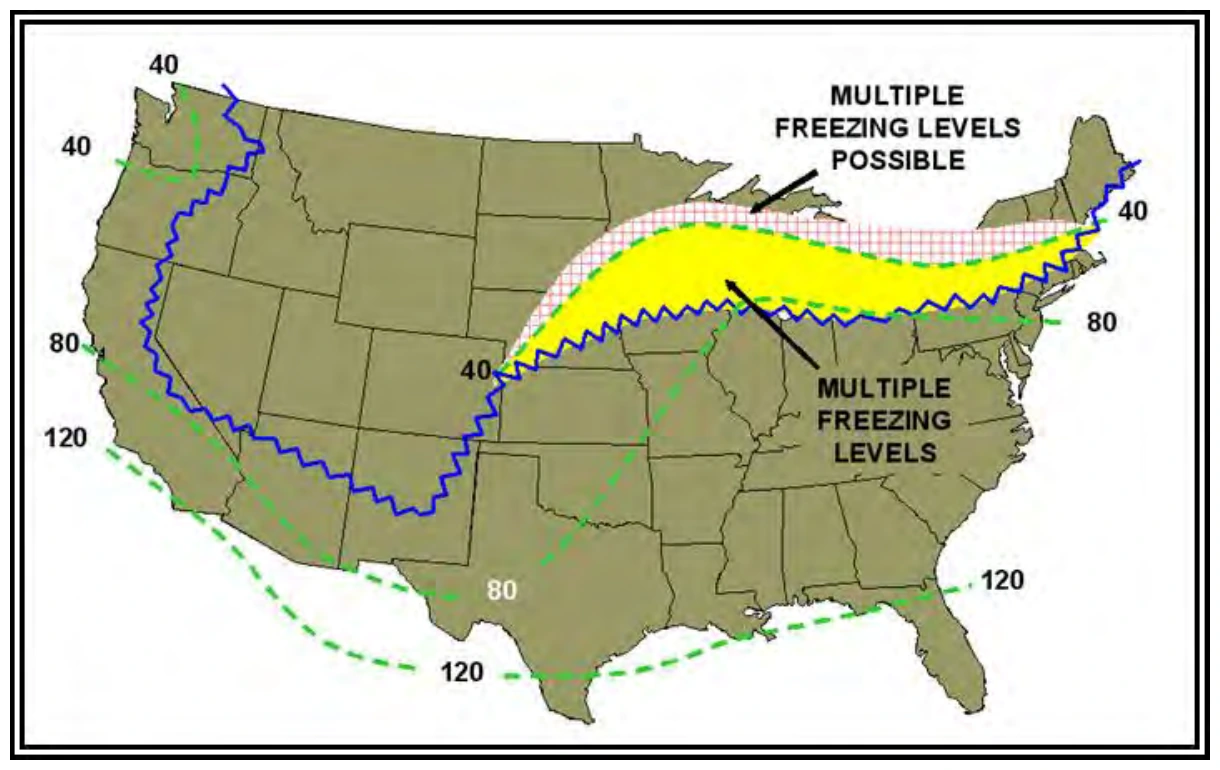
The words “Multiple Freezing Levels Possible” and/or “Multiple Freezing Levels,” and/or associated shading and hatched area do not appear on the chart. Note: The colors used in this example are different from those used in other examples.
In Figure 27-15, areas with multiple freezing levels are located on the below-freezing side of the surface freezing level contour and bounded by the 4,000-ft freezing level. Multiple freezing levels are possible beyond the 4,000-ft freezing level (i.e., below 4,000 ft MSL), but the exact cutoff cannot be determined.
27.9.2 Mid-Level Significant Weather (SIGWX) Chart
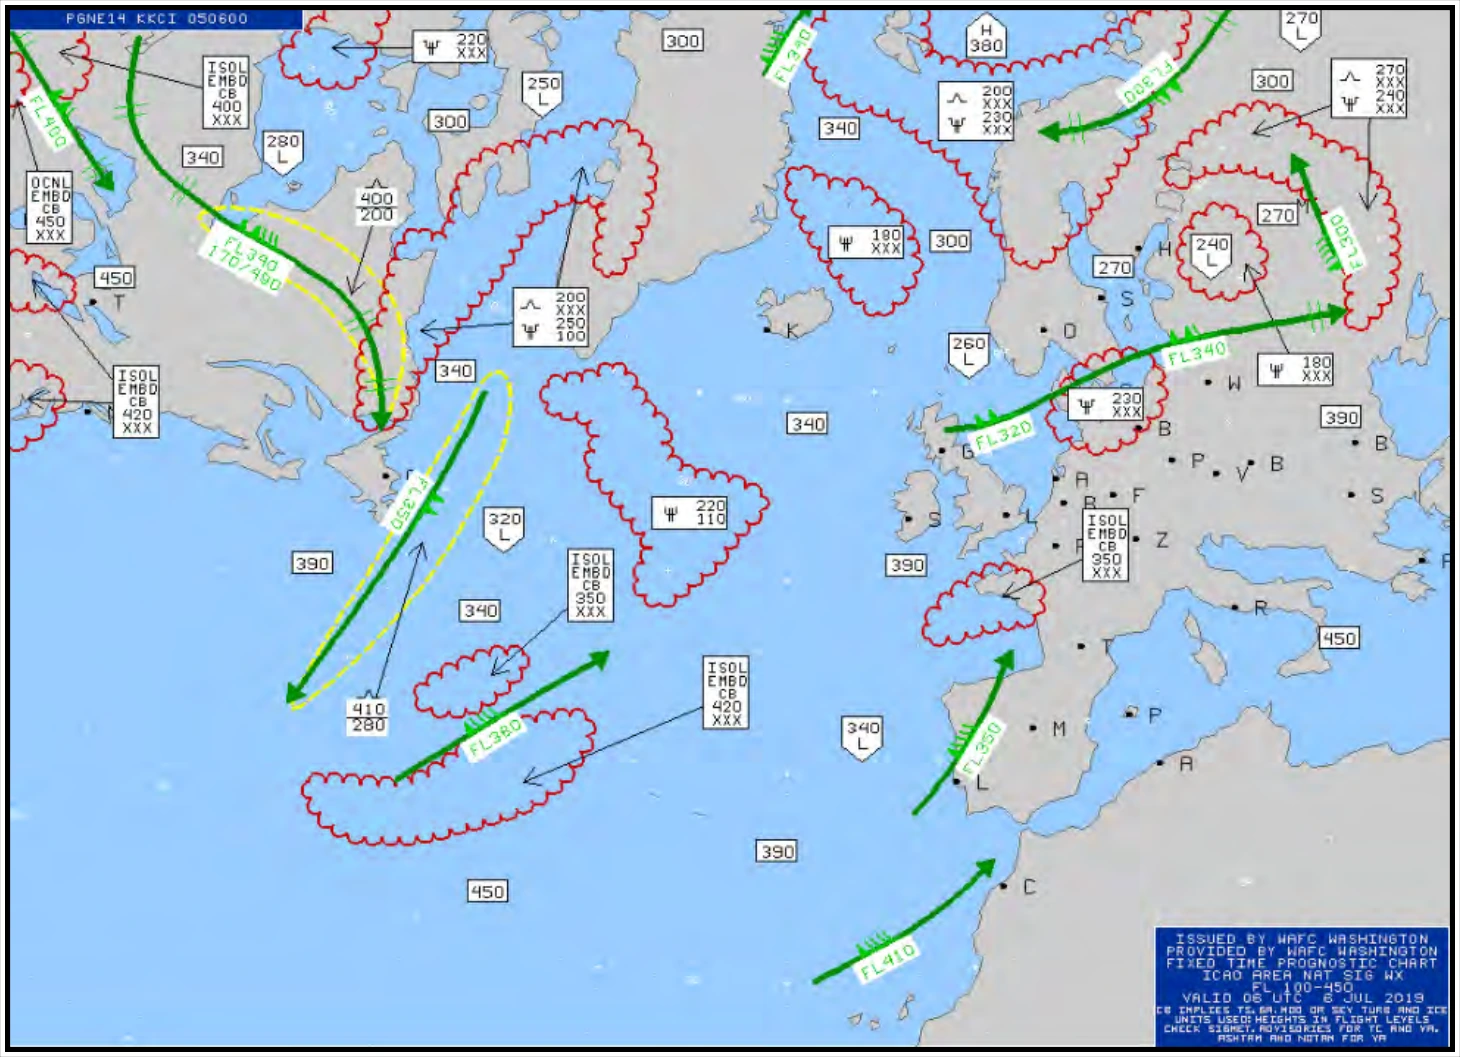
The Mid-Level SIGWX Chart (see Figure 27-16) is a product of ICAO’s WAFS. The Mid-Level SIGWX Chart is also known as the Medium-Level SIGWX Chart. The Mid-Level SIGWX Chart is planned to be phased out in 2024 and replaced by new WAFS SIGWX forecasts.
The Mid-Level SIGWX Chart provides a forecast of significant en route weather phenomena over a range of FLs from 10,000 ft MSL to FL450. The chart depicts a “snapshot” of weather expected at the specified valid time. It can be used by airline dispatchers for flight planning and weather briefings before departure and by flightcrew members during flight.
27.9.2.1 Issuance
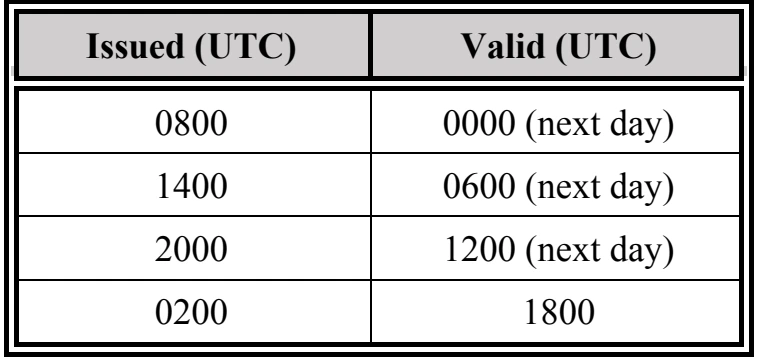
The AWC in Kansas City, MO, has the responsibility, as part of the WAFC Washington, to provide global weather forecasts of SIGWX phenomena. The AWC issues a 24-hour Mid-Level SIGWX Chart, four times daily, for the North Atlantic Ocean Region (see Table 27-11).
27.9.2.2 Content
The Mid-Level SIGWX Chart depicts numerous weather elements that can be hazardous to aviation. The weather elements and their presentation are the same as in the High-Level SIGWX Charts (see Section 27.9.3) except for the addition of non-convective clouds with moderate or severe icing and/or moderate or severe turbulence. See Section 27.9.3.2 for details on these other weather elements.
27.9.2.2.1 Non-Convective Clouds with Moderate or Severe Icing and/or Moderate or Severe Turbulence
Areas of non-convective clouds with moderate or severe icing and/or moderate or severe turbulence are depicted by enclosed (red) scalloped lines (see Figure 27-16). The type of icing (i.e., rime, clear, or mixed) is not forecast.
The identification and characterization of each area appears within or adjacent to the outlined area. If the identification and characterization is adjacent to an outlined area, an arrow points to the appropriate area.