
Chapter 27
Forecasts
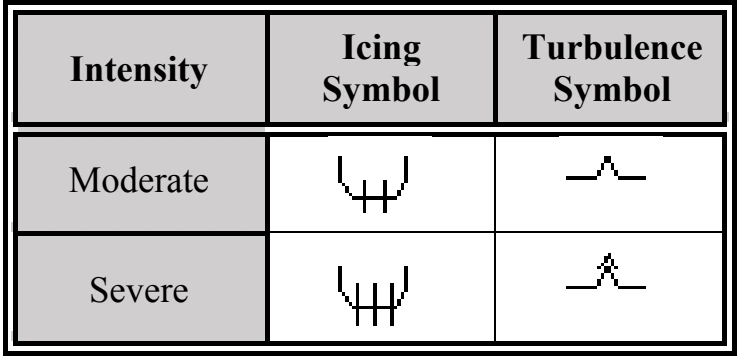
The identification box uses the standard icing symbol (see Table 27-12). The vertical extent of the icing layer is specified by top and base heights. When the bases extend below 10,000 ft MSL, they are identified with XXX.
27.9.3 High-Level Significant Weather (SIGWX) Charts
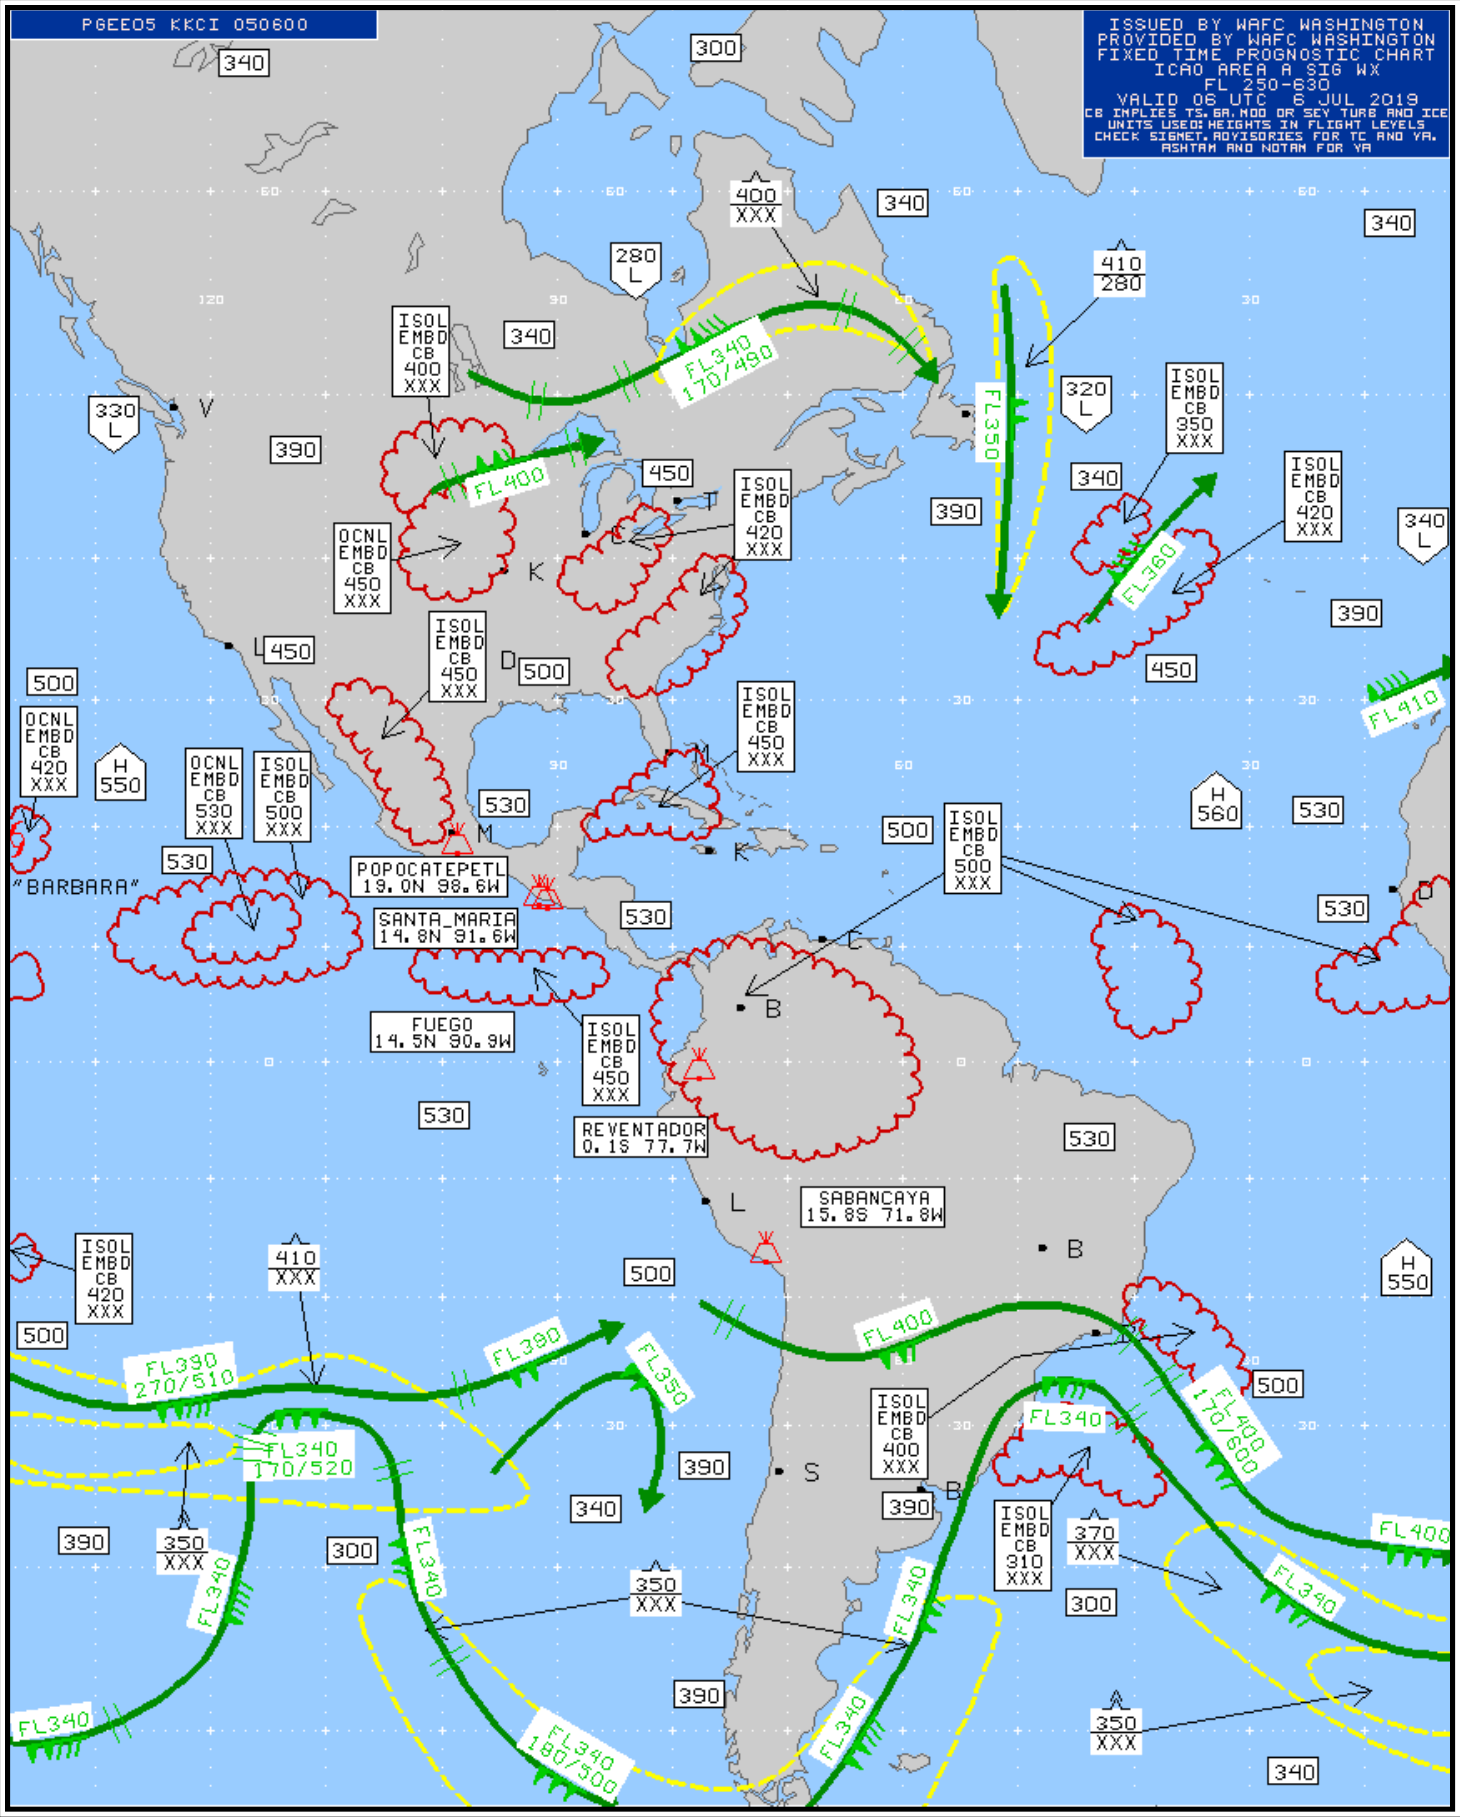
High-Level SIGWX Charts (see Figure 27-17) provide a forecast of significant en route weather phenomena over a range of FLs from FL250 to FL630. Each chart depicts a “snapshot” of weather expected at the specified valid time. The vertical range is planned to change in 2024 to FL100 to FL600 with the planned implementation of new WAFS SIGWX forecasts, which will have 3-hour time steps (valid times) from 0 to 48 hours.
High-Level SIGWX forecasts are provided for the en route portion of international flights. These products are used by airline dispatchers for flight planning and weather briefings before departure and by flightcrew members during flight.
27.9.3.1 Issuance
In accordance with the WAFS of ICAO, High-Level SIGWX forecasts are provided for the en route portion of international flights.
High-Level SIGWX forecasts are issued as a global data set in digital format by two WAFCs, one at the NWS AWC and the other at the United Kingdom’s Meteorological Office. Each center produces a global data set of SIGWX that is then made available (displayed) in chart form for different areas of the globe. These charts are available on the AWC’s website.
Corrections are issued for format errors or missing information. These charts are not amended.
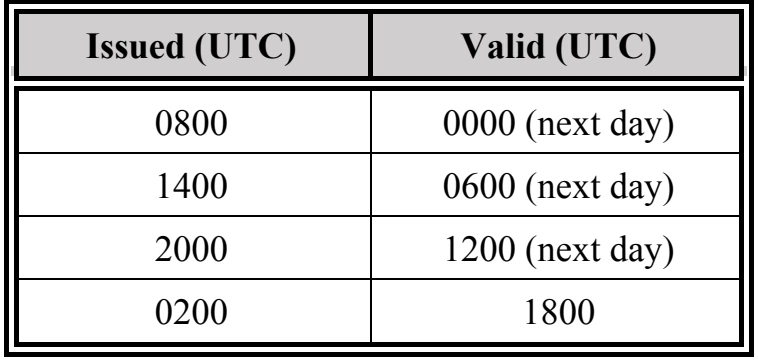
Table 27-13 provides the issuance schedule.
27.9.3.2 Content
27.9.3.2.1 Thunderstorms and Cumulonimbus Clouds
The abbreviation CB is only included where it refers to the expected occurrence of an area of widespread cumulonimbus clouds, cumulonimbus along a line with little or no space between individual clouds, cumulonimbus embedded in cloud layers, or cumulonimbus concealed by haze. It does not refer to isolated cumulonimbus not embedded in cloud layers or concealed by haze.
Each cumulonimbus area is identified with CB and characterized by coverage, bases, and tops.
Coverage is identified as isolated (ISOL) meaning less than 4/8, occasional (OCNL) meaning 4/8 to 6/8, and frequent (FRQ) meaning more than 6/8 coverage. Isolated CBs can only be depicted when they are embedded (EMBD) in clouds or concealed by haze. Occasional cumulonimbus can be depicted with or without EMBD.
The vertical extent of the cumulonimbus layer is specified by top and base heights. Bases that extend below FL250 (the lowest altitude limit of the chart) are encoded XXX.
Cumulonimbus clouds are depicted by enclosed (red) scalloped lines. The identification and characterization of each cumulonimbus area will appear within or adjacent to the outlined area. If the identification and characterization is adjacent to an outlined area, an arrow will point to the associated cumulonimbus area.
On SIGWX charts, the inclusion of CB shall be understood to include all weather phenomena normally associated with cumulonimbus (e.g., thunderstorm, moderate or severe icing, moderate or severe turbulence, and hail).